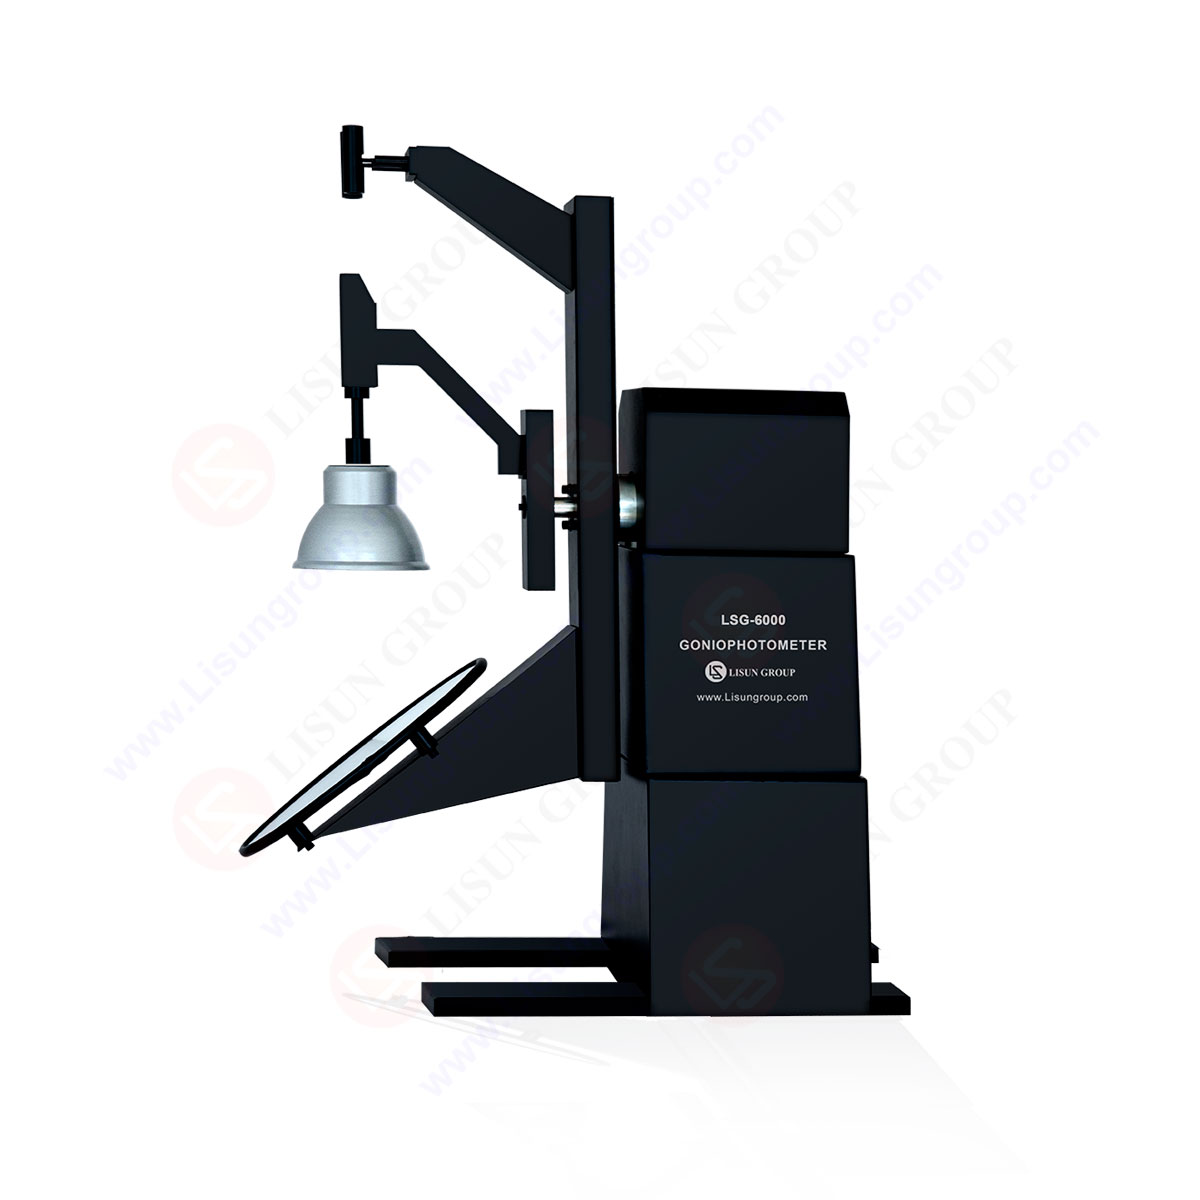
LM-79 Moving Detector Goniophotometer (Mirror Type C)
LSG-6000
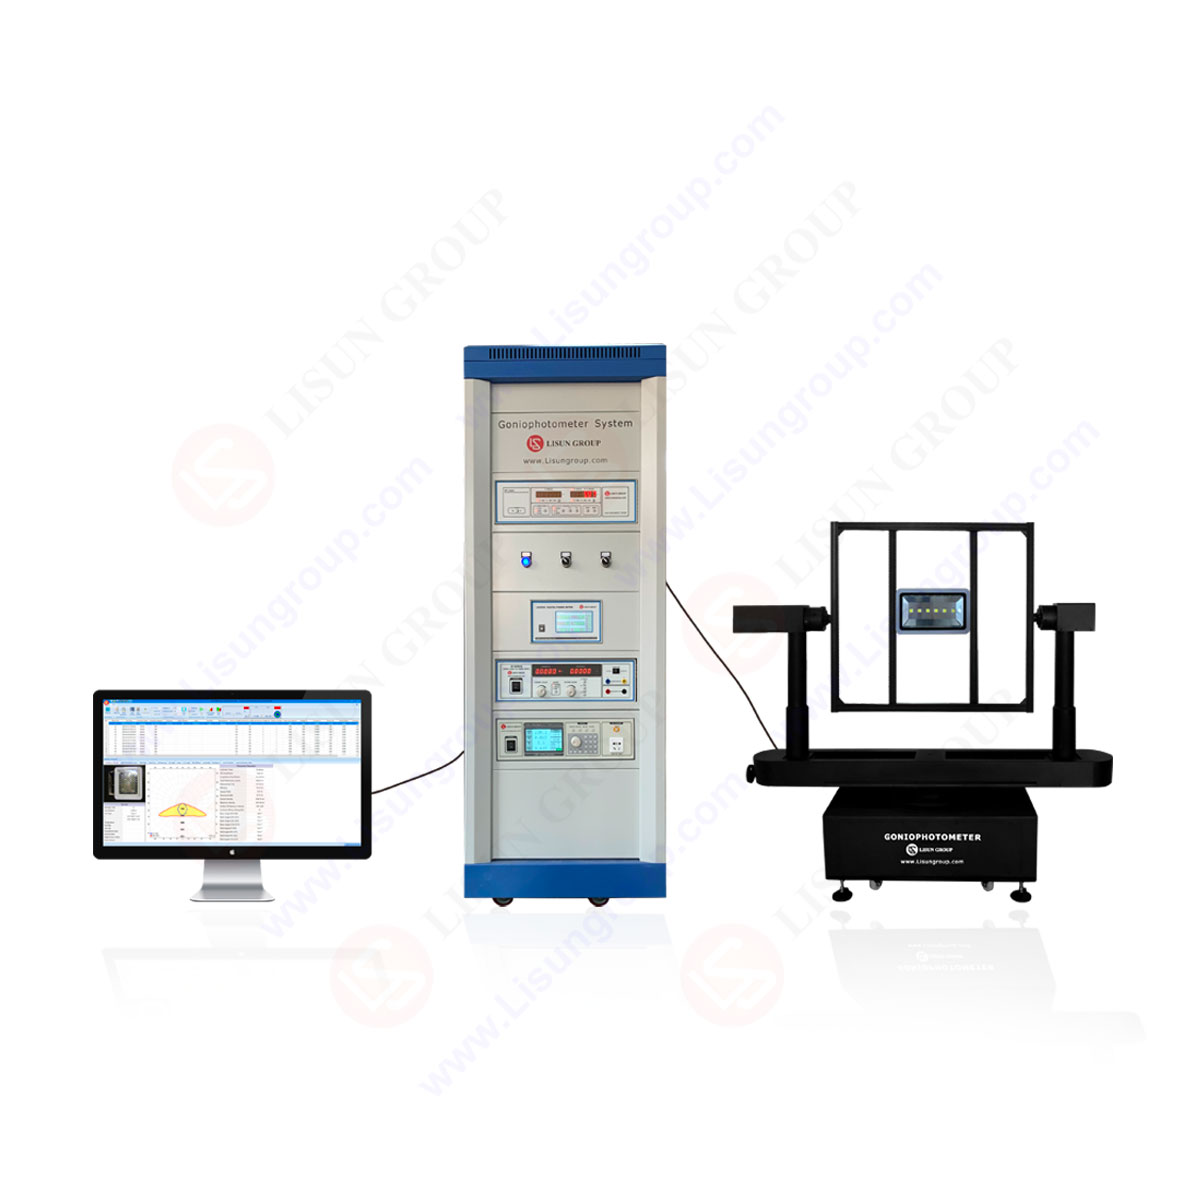
High Precision Rotation Luminaire Goniophotometer
LSG-1890B
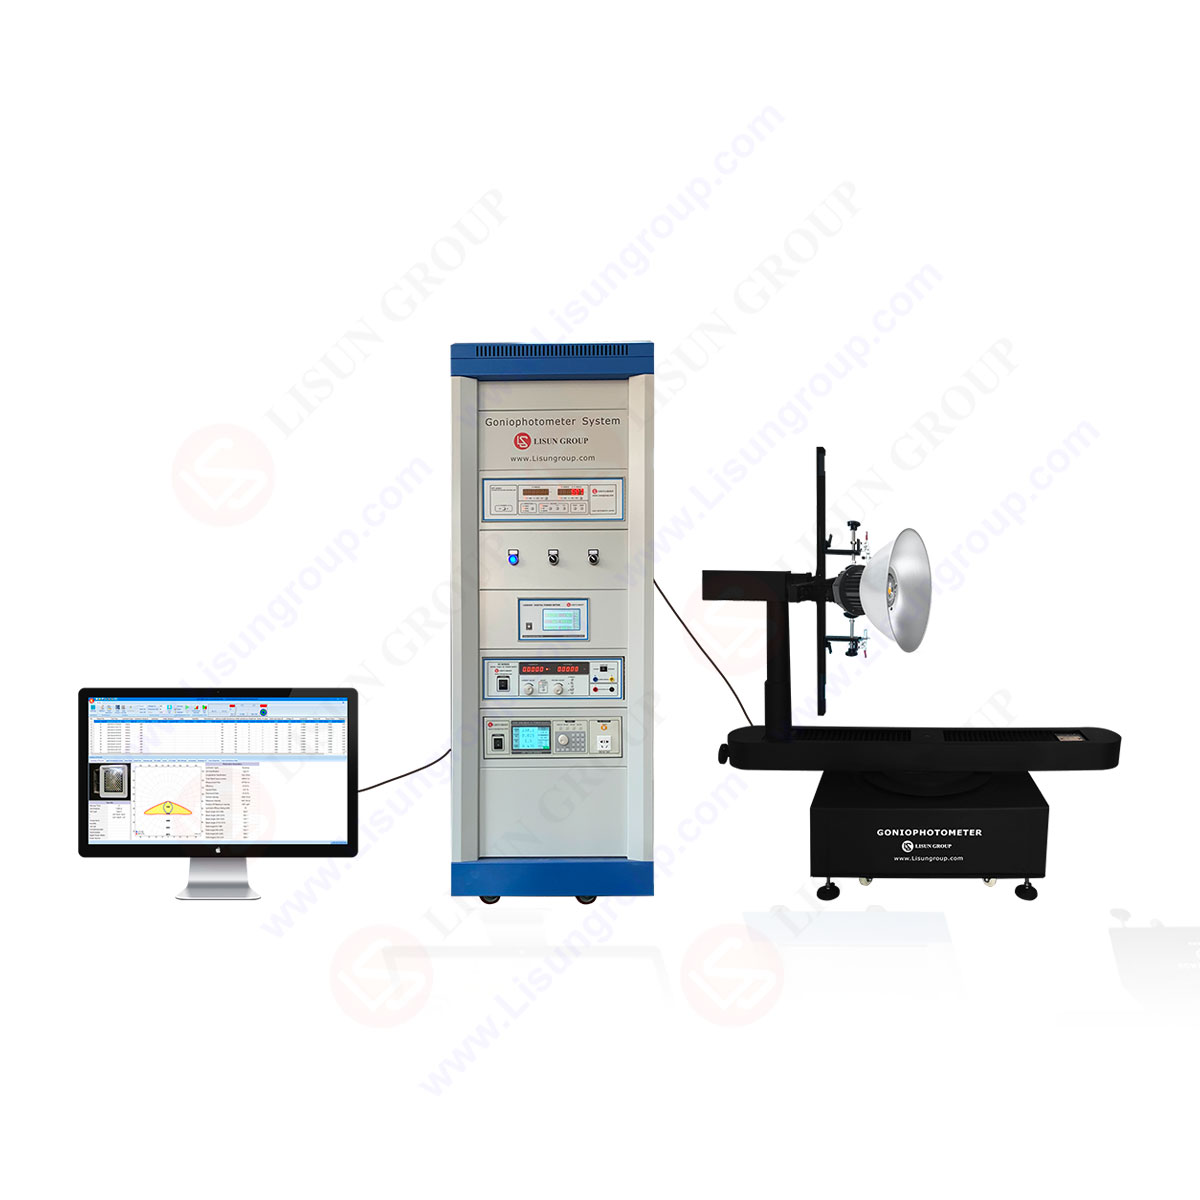
High Precision Rotation Luminaire Goniospectroradiometer
LSG-1890BCCD
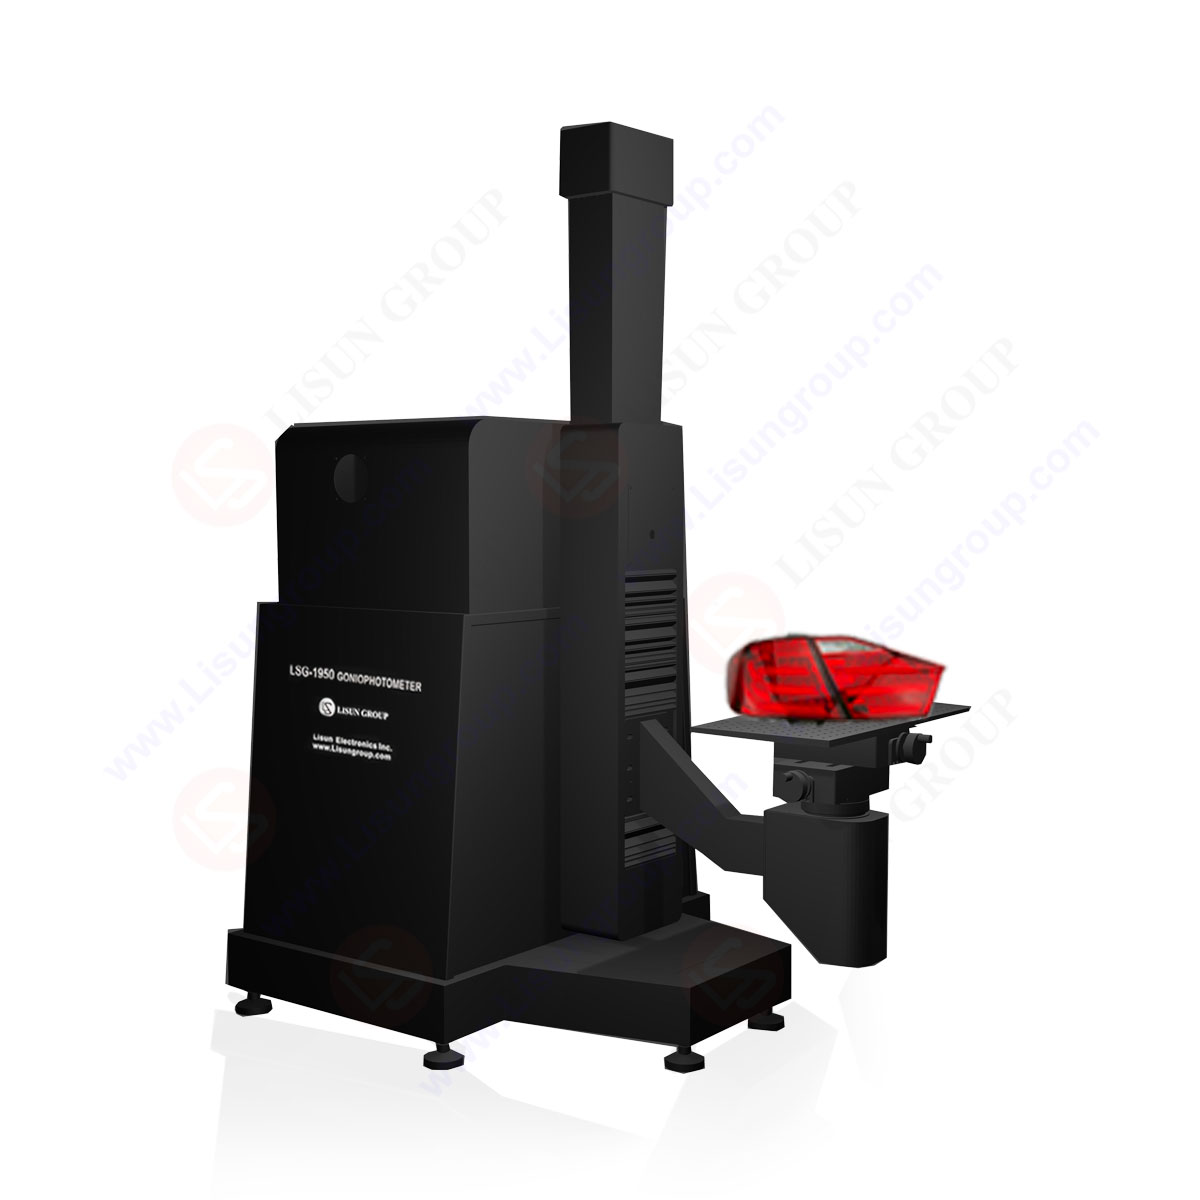
Goniophotometer for Automotive and Signal Lamps
LSG-1950
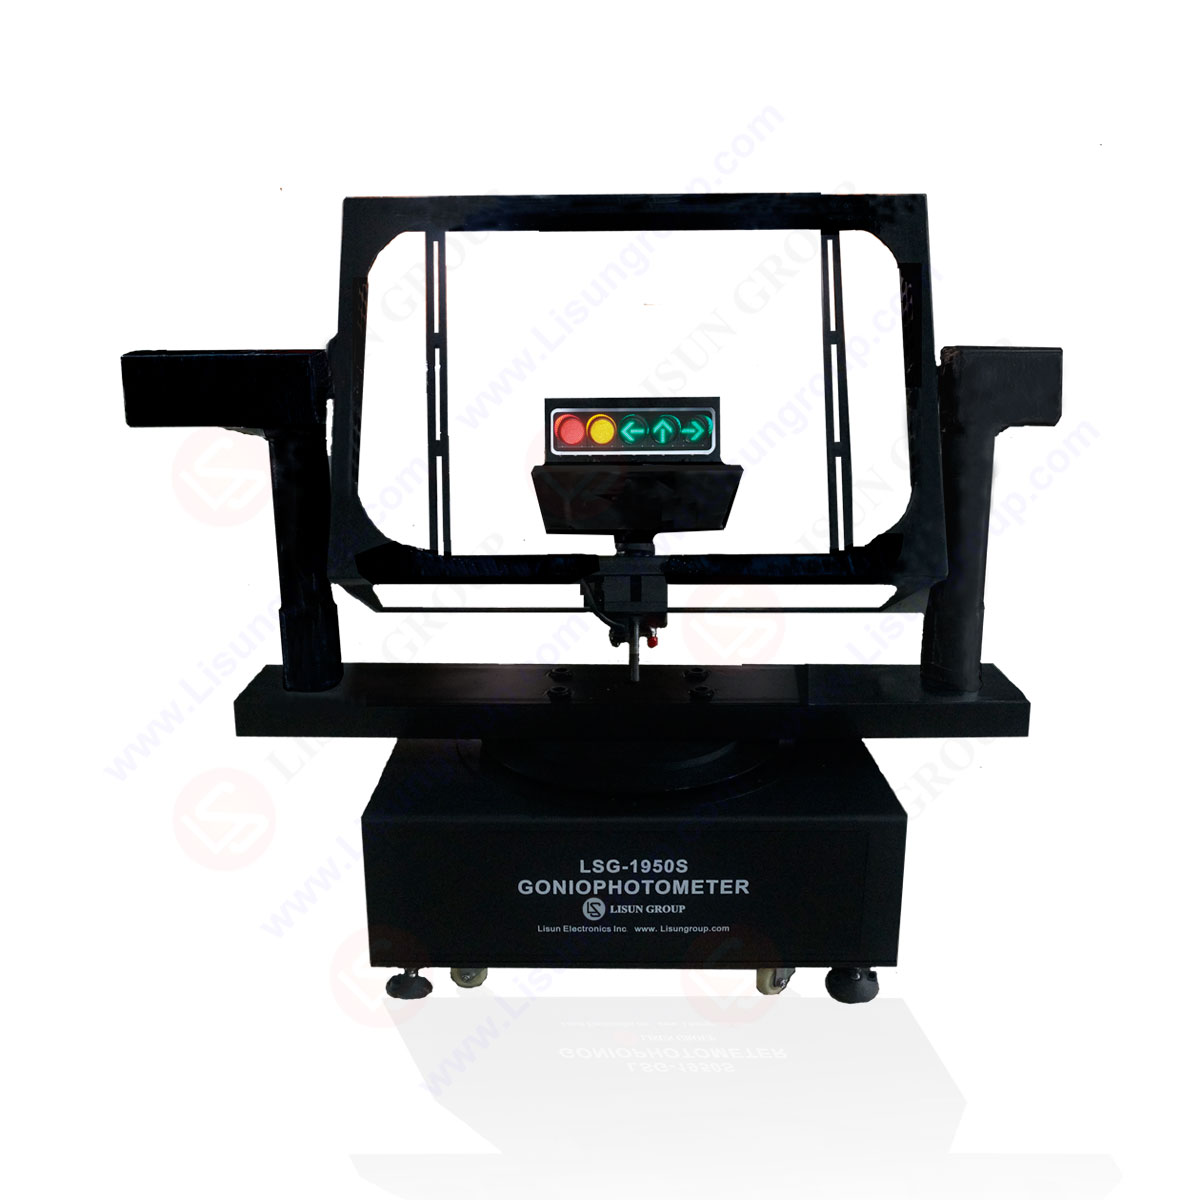
Goniophotometer for Traffic Signal Lamps
LSG-1950S
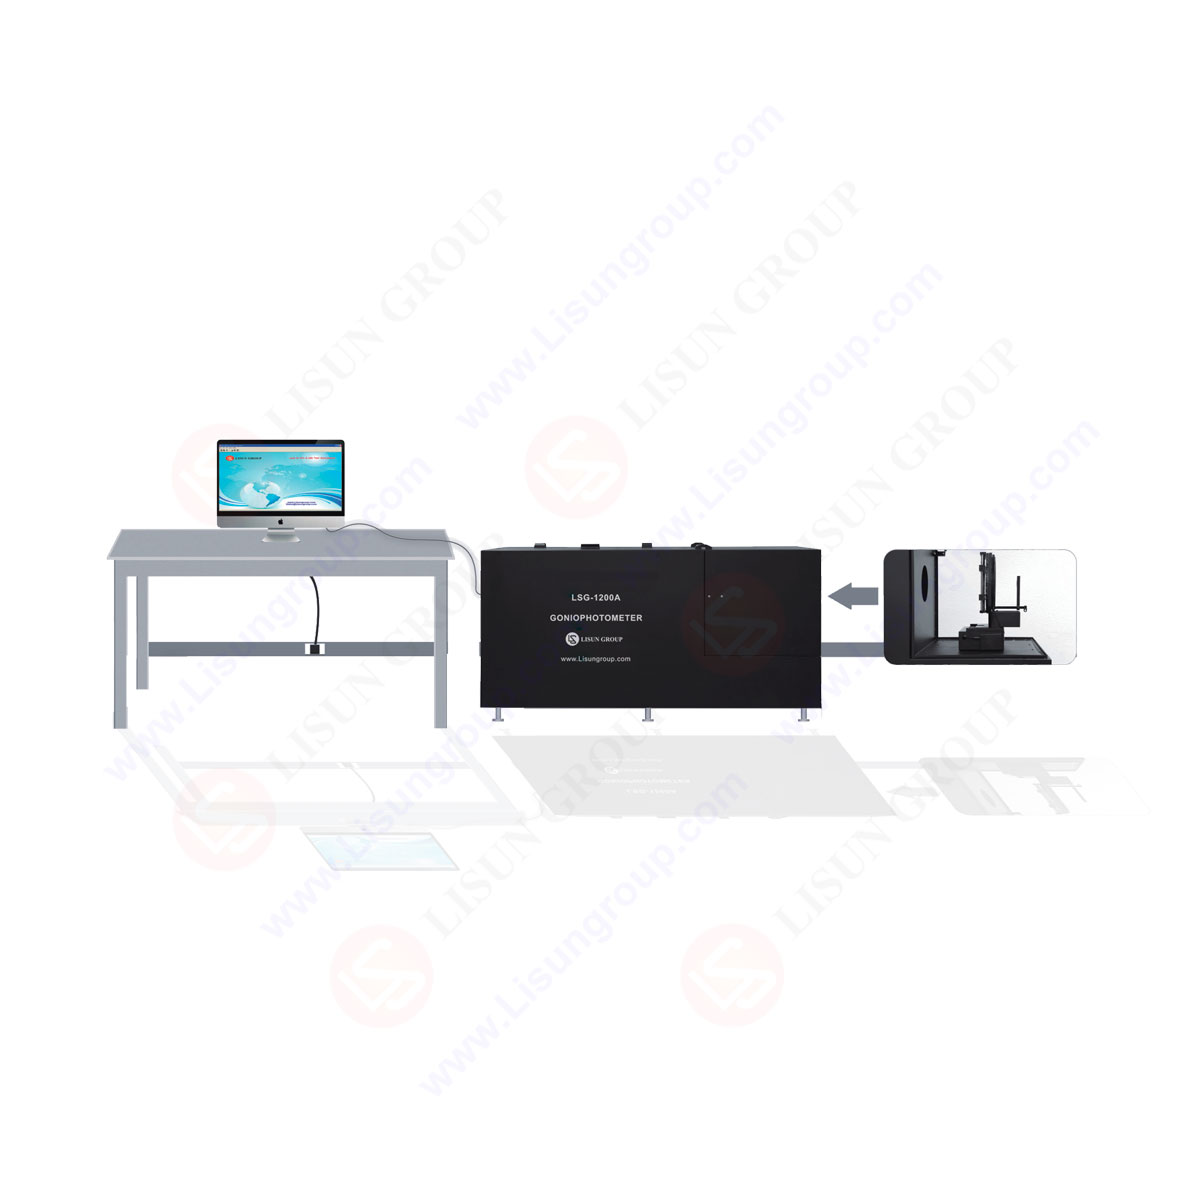
Compact Goniophotometer
LSG-1200A

Near Field Moving Detector Goniophotometer
LSG-1900B
Select an organization
to browse standards
Introduction:
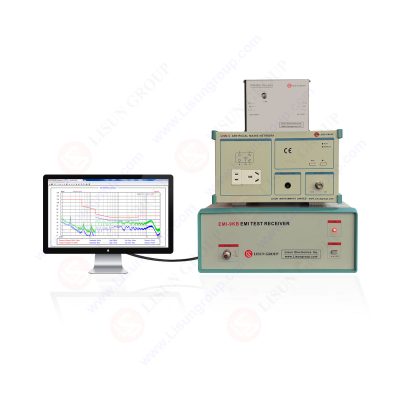
Analysis of electromagnetic interference (EMI) is essential for assuring the EMC of electronic equipment and systems. Modern EMI test receivers use complex signal processing methods to improve the reliability and speed of EMI analysis, thanks to technological advancements.
In this piece, we’ll go into the different signal processing methods used in tandem with test receivers for more accurate EMI analysis. Engineers may improve the functionality and dependability of electronic equipment by using these methods to detect, analyze, and eliminate EMI interference.
Fourier Transform and Spectrum Analysis:
The Fourier transform is one of the most fundamental methods used in electromagnetic interference (EMI) investigation. The transformation of a signal from the time domain to the frequency domain allows engineers to evaluate the spectral components of a signal.
In order to conduct an immediate analysis of the spectrum, EMI test receivers make use of the Fast Fourier Transform (FFT) and other related Fourier transform algorithms. This technology makes it feasible to view the frequency composition of the electromagnetic spectrum and pinpoint the interference’s sources.
Windowing:
By using the windowing technique, one is able to improve the resolution of spectral analysis while simultaneously reducing spectral leakage. Before the Fourier transform is performed to the acquired signal, it is common practice for EMI test receivers to first make use of window functions such as Hamming, Hanning, and Blackman.
Windowing is a technique that helps enhance spectral analysis and the detection of narrowband interference signals by reducing the significance of the effect of signal discontinuities at the window’s edges.
Spectrogram Analysis:
In order to provide a complete picture of the signal’s properties across time, spectrogram analysis incorporates data from both the time domain and the frequency domain. Engineers may examine the signal’s spectral composition over time by using the short-time Fourier transform (STFT).
Engineers are better able to spot transient or intermittent interference with the use of spectrogram analysis tools included into EMI test receivers.
Digital Filtering:
Signals are filtered digitally to remove undesirable background noise or interference. Digital filters including low-pass filters, high-pass filters, band-pass filters, and notch filters are used in EMI test receivers to focus on a narrow frequency band. Filtering improves the accuracy of EMI analysis by making it easier to detect and evaluate the spectral components associated with EMI sources.
Peak Detection and Classification:
To locate and label noteworthy spikes or peaks in the frequency spectrum, we use peak detection methods. In order to locate and monitor the highest amplitude peaks over time, EMI test receivers use methods like peak hold and peak search algorithms.
Engineers are better able to focus mitigation efforts by distinguishing between normal signal components and possible EMI sources thanks to this method of categorizing peaks based on their properties.
Time-Domain Analysis:
Understanding the temporal behavior of EMI signals requires both frequency-domain and time-domain research. Time-domain measures such as pulse width, rise time, and repetition rate are provided by EMI test receivers, allowing transient or impulsive interference sources to be identified and characterized.
Time-domain analysis is a useful tool for engineers in determining the extent to which EMI events degrade the functionality of electronic equipment and planning for mitigation strategies.
Statistical Analysis:
Engineers may now glean useful insights from massive troves of EMI data using statistical analysis methods. Probability density functions (PDF), cumulative distribution functions (CDF), and statistical hypothesis testing are only a few of the statistical methods used by EMI test receivers to examine the statistical features of EMI signals.
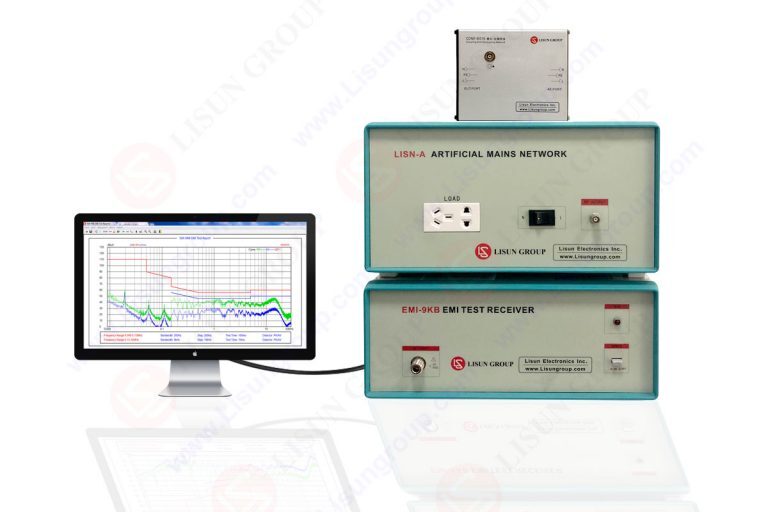
With the use of statistics, we can put a number on the impact of EMI problems, spot patterns, and determine what constitutes a violation of EMC regulations. LISUN has the best equipment for EMI testing.

EMI-9KB EMI Test Receiver
Correlation and Cross-Correlation:
The correlation and cross-correlation procedures are used while conducting an investigation into the link that exists between two signals or when comparing signals obtained from a great number of channels. EMI test receivers utilize correlation and cross-correlation algorithms in order to locate similarities or patterns in test signals.
Engineers may use this approach to locate harmonic or spurious emission sources more accurately, which are connected with one another yet originate from separate components of an electronic device or system.
Advanced Signal Processing Algorithms:
In today’s world, electromagnetic interference (EMI) analysis may be relied on to a greater extent than ever before owing to the introduction of complex signal processing algorithms into EMI test receivers. Using techniques like adaptive filtering, blind source separation, and wavelet transformations, engineers are able to extract usable information from intricate EMI signals.
These techniques are used to decrease or remove noise or interference in the signals. If engineers embrace these cutting-edge technologies, it is possible for them to increase their capacity to detect and identify EMI sources, even in challenging or noisy environments.
Pattern Recognition and Machine Learning:
When doing EMI analysis using test receivers, it is becoming more standard practice to make advantage of pattern recognition and machine learning. Among these techniques is instructing computers to detect and classify EMI signals according to the characteristic fingerprints of the signals themselves.
EMI test receivers can automatically differentiate between typical operating signals and interference events thanks to the use of machine learning methods. This not only speeds up analysis but also points to the most probable sources of interference.
Signal Averaging:
The signal-to-noise ratio of recorded EMI is enhanced using signal averaging, a method of signal processing. Engineers can better detect weak or intermittent interference signals by averaging repeated captures of the same signal to eliminate random noise.
In order to increase the sensitivity and precision of EMI measurements, especially in low-level or intermittent EMI conditions, EMI test receivers contain signal averaging capabilities.
Real-Time Monitoring and Visualization:
Real-time monitoring and visualization are essential components of signal processing when employing EMI test receivers. It is possible for engineers to see the results of the study in real time, which provides insight into the presence of EMI sources, the nature of the frequencies emitted by those sources, and how those frequencies change over time.
Real-time monitoring makes it feasible to both proactively identify instances of electromagnetic interference (EMI) and make prompt judgments on the most effective strategies for mitigating its effects.
Post-Processing and Reporting:
After conducting a study of EMI signals, engineers may benefit from the post-processing and reporting services offered by EMI test receivers. These activities assist engineers with the arrangement and presentation of data.
Among these are the capabilities of producing detailed reports, exporting information in a variety of formats, and making data accessible for group study. Engineers are able to take a more scientific approach to the EMI study thanks to post-processing tools, which allow for the recording of observations, the monitoring of trends, and the comparison of data from many test runs.
Conclusion:
Improved EMI analysis using test receivers made possible by signal processing methods has allowed engineers to better detect, analyze, and control electromagnetic interference. Engineers are able to glean useful information from EMI signals by using techniques such as the Fourier transform, windowing, spectrogram analysis, digital filtering, peak identification, time-domain analysis, statistical analysis, correlation, sophisticated algorithms, pattern recognition, and machine learning.
With the use of these methods, engineers can pinpoint the origins of EMI, categorize interference events, measure their impact, and design effective countermeasures. The continual incorporation of modern signal processing methods in EMI test receivers offers increased accuracy, efficiency, and reliability in electromagnetic compatibility tests in light of the ever-increasing complexity of EMI issues.
Lisun Instruments Limited was found by LISUN GROUP in 2003. LISUN quality system has been strictly certified by ISO9001:2015. As a CIE Membership, LISUN products are designed based on CIE, IEC and other international or national standards. All products passed CE certificate and authenticated by the third party lab.
Our main products are Goniophotometer, Integrating Sphere, Spectroradiometer, Surge Generator, ESD Simulator Guns, EMI Receiver, EMC Test Equipment, Electrical Safety Tester, Environmental Chamber, Temperature Chamber, Climate Chamber, Thermal Chamber, Salt Spray Test, Dust Test Chamber, Waterproof Test, RoHS Test (EDXRF), Glow Wire Test and Needle Flame Test.
Please feel free to contact us if you need any support.
Tech Dep: Service@Lisungroup.com, Cell/WhatsApp:+8615317907381
Sales Dep: Sales@Lisungroup.com, Cell/WhatsApp:+8618117273997

LISUN’s Motor-Operated Tool | Power Tool Testing solutions strictly comply with a range of core international standards, providing full support for safety and electromagnetic compatibility (EMC)...
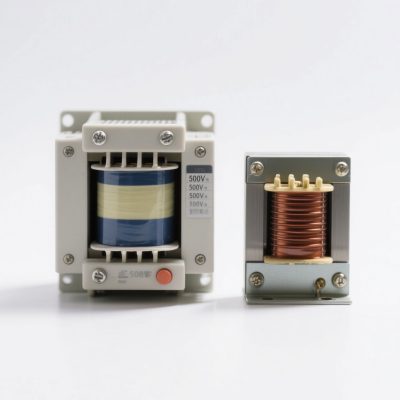
LISUN’s transformer test solutions meet IEC 61558-1, IEC 60076-1, IEC 62041 standards. Covering safety, performance, EMC tests, ensuring transformers comply with global requirements.
LISUN’s household and appliance switch testing solutions meet IEC 60669, IEC 61058, IEC 62271 standards. Covering electrical, mechanical & EMC tests for global compliance.

For the CFL design and manufactory, LISUN can supply a full quality control test solution, including photometric, colorimetric, electricity, flicker, IES candela distribution, surge test, electrical...

 中文简体
中文简体