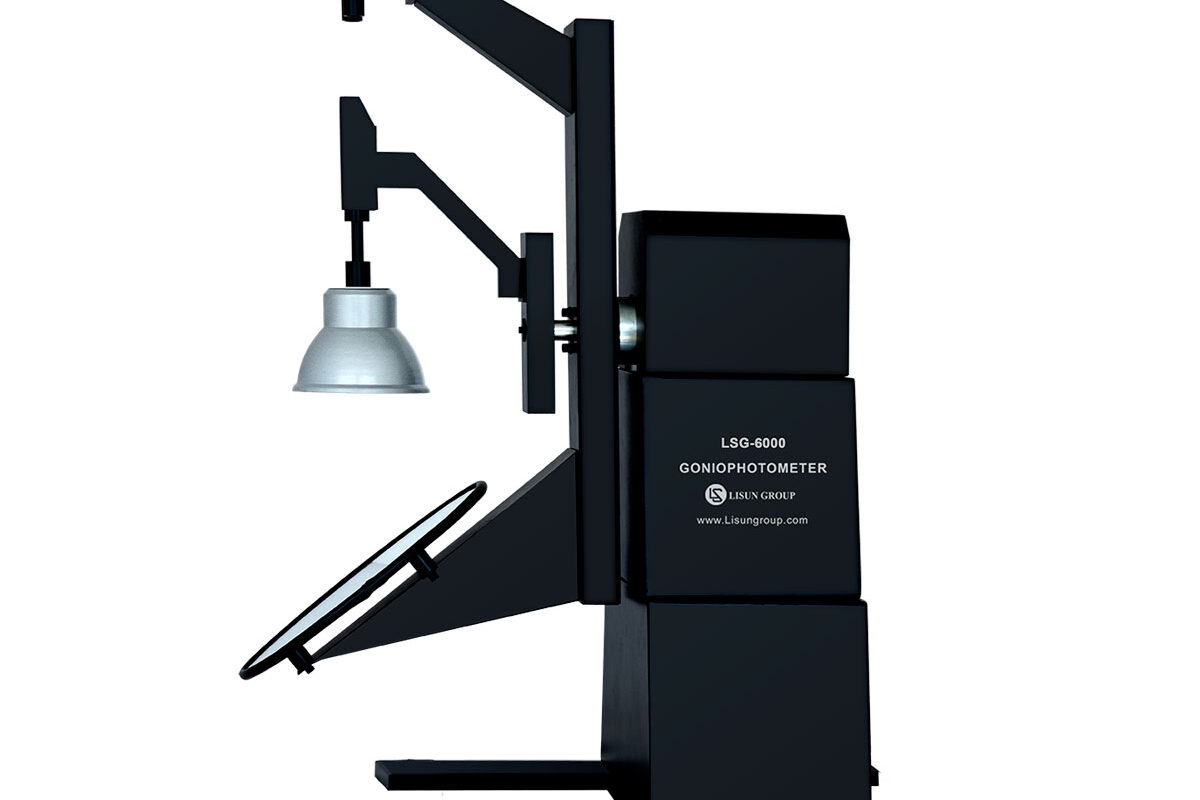
LM-79 Moving Detector Goniophotometer (Mirror Type C)
LSG-6000
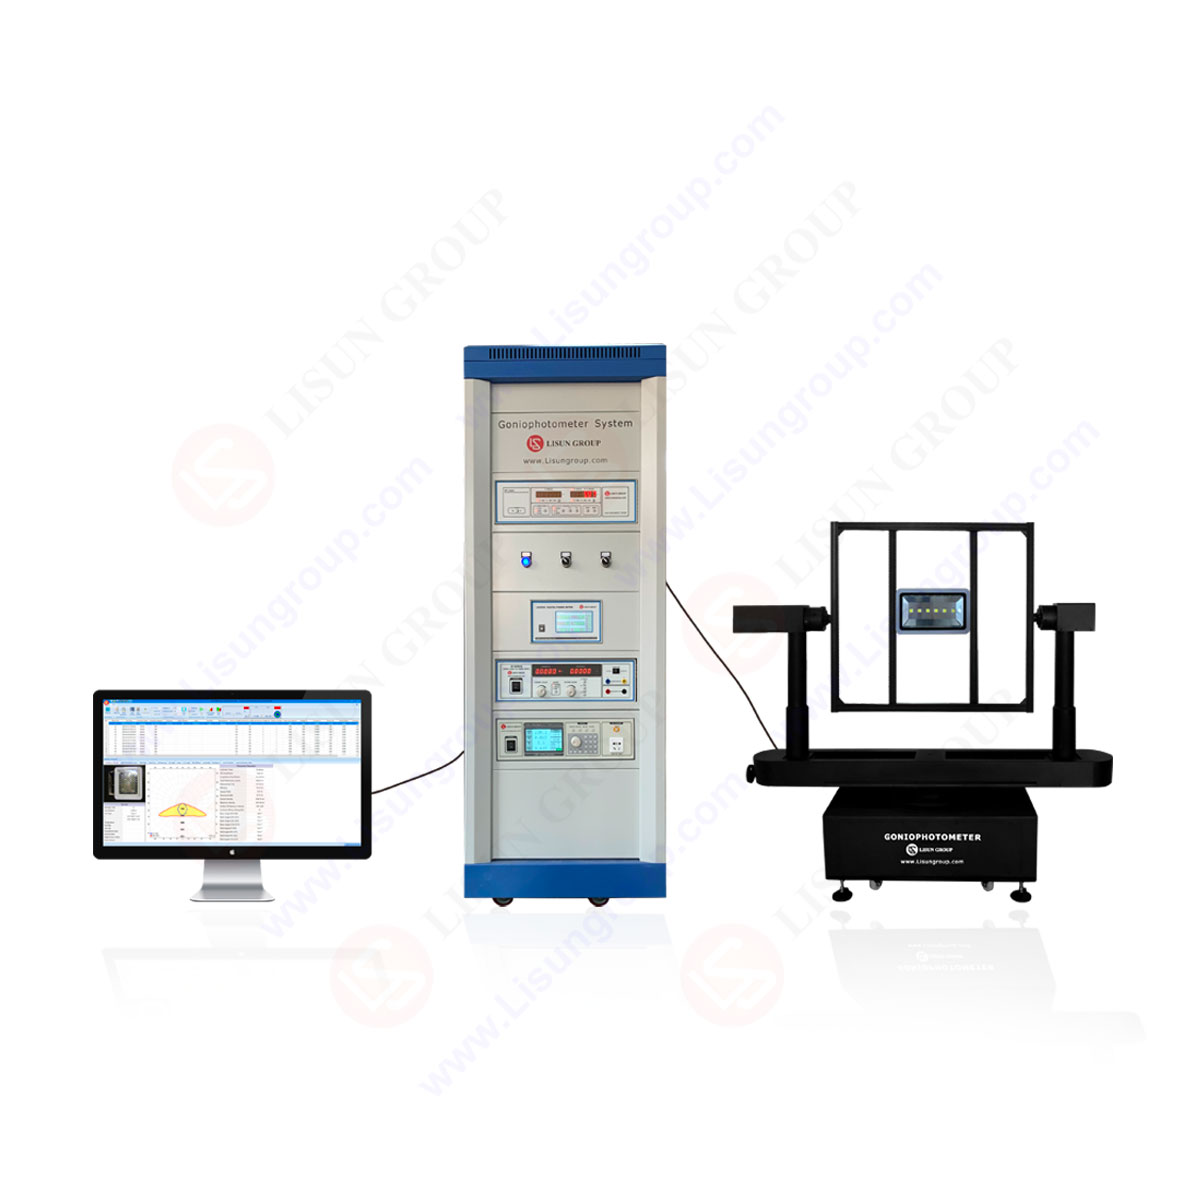
High Precision Rotation Luminaire Goniophotometer
LSG-1890B
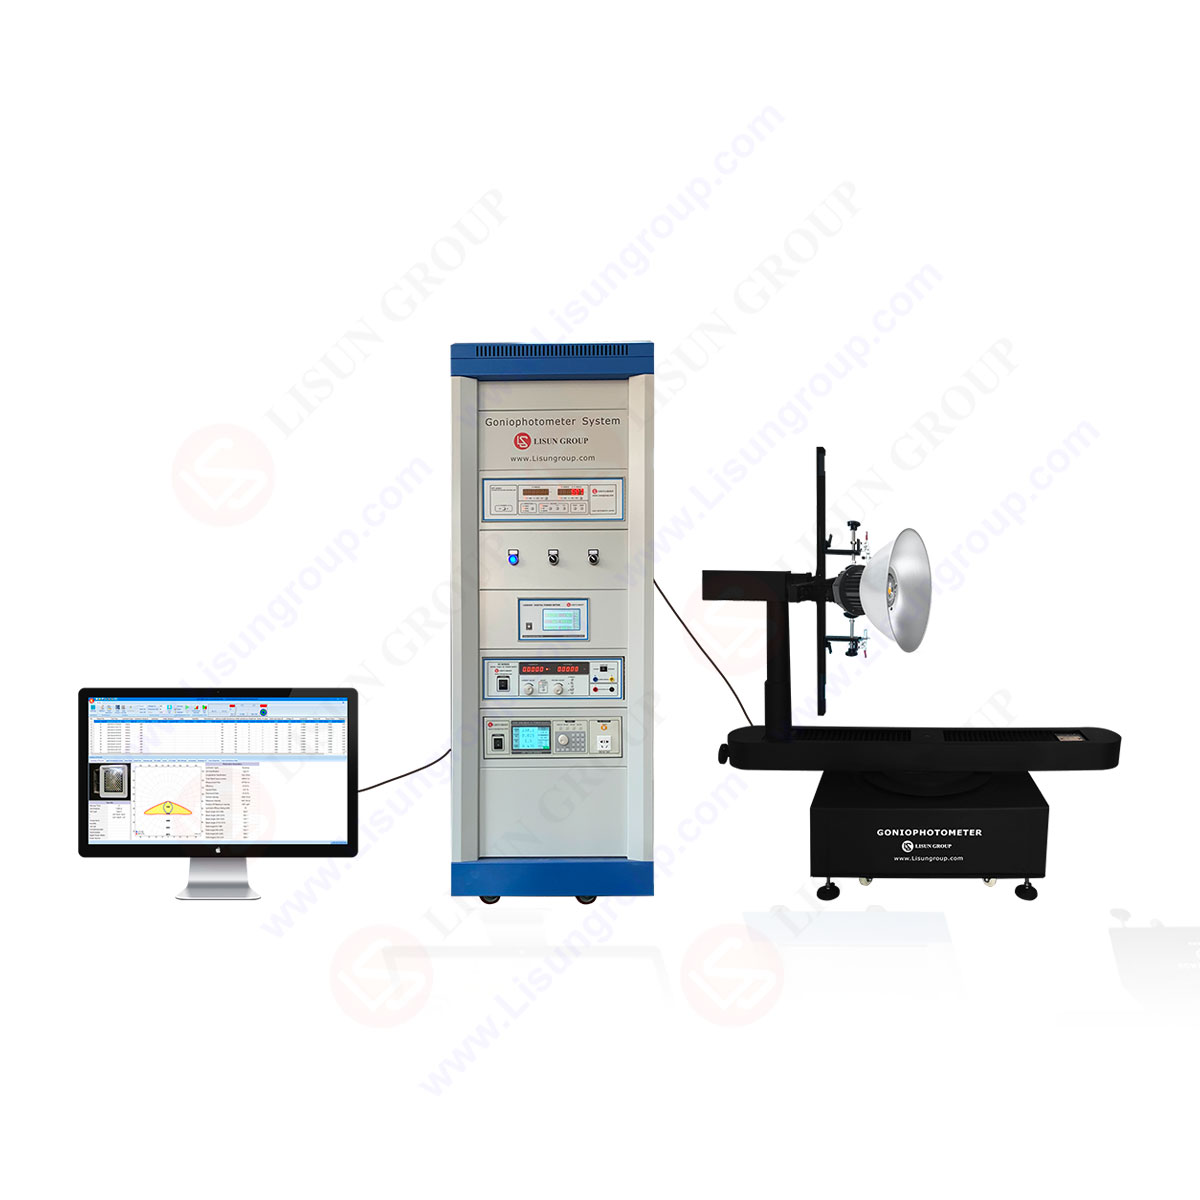
High Precision Rotation Luminaire Goniospectroradiometer
LSG-1890BCCD
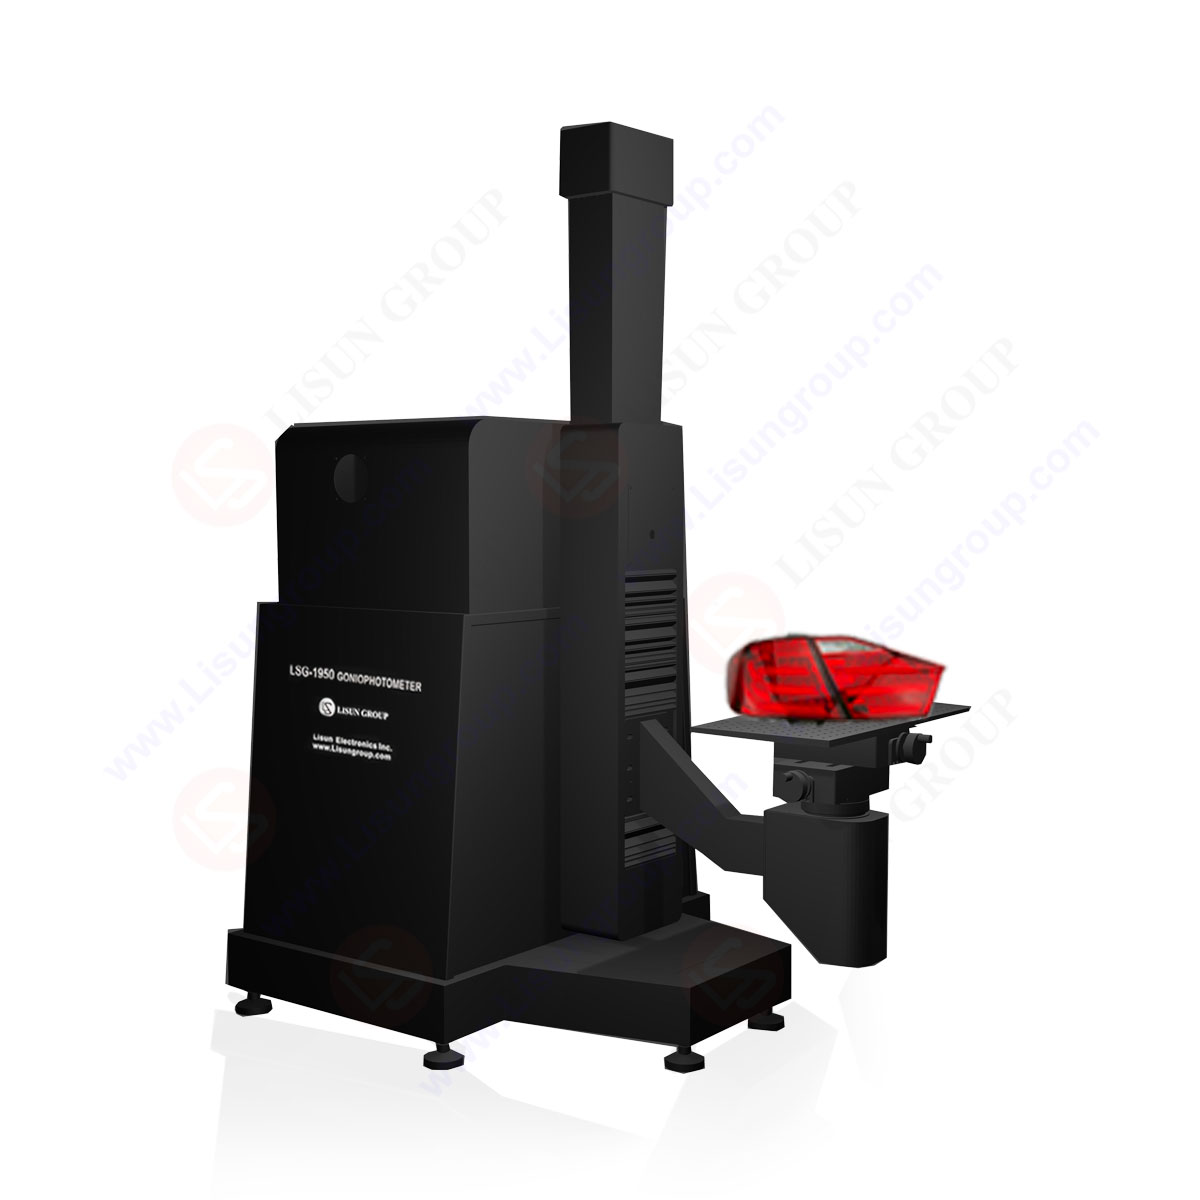
Goniophotometer for Automotive and Signal Lamps
LSG-1950
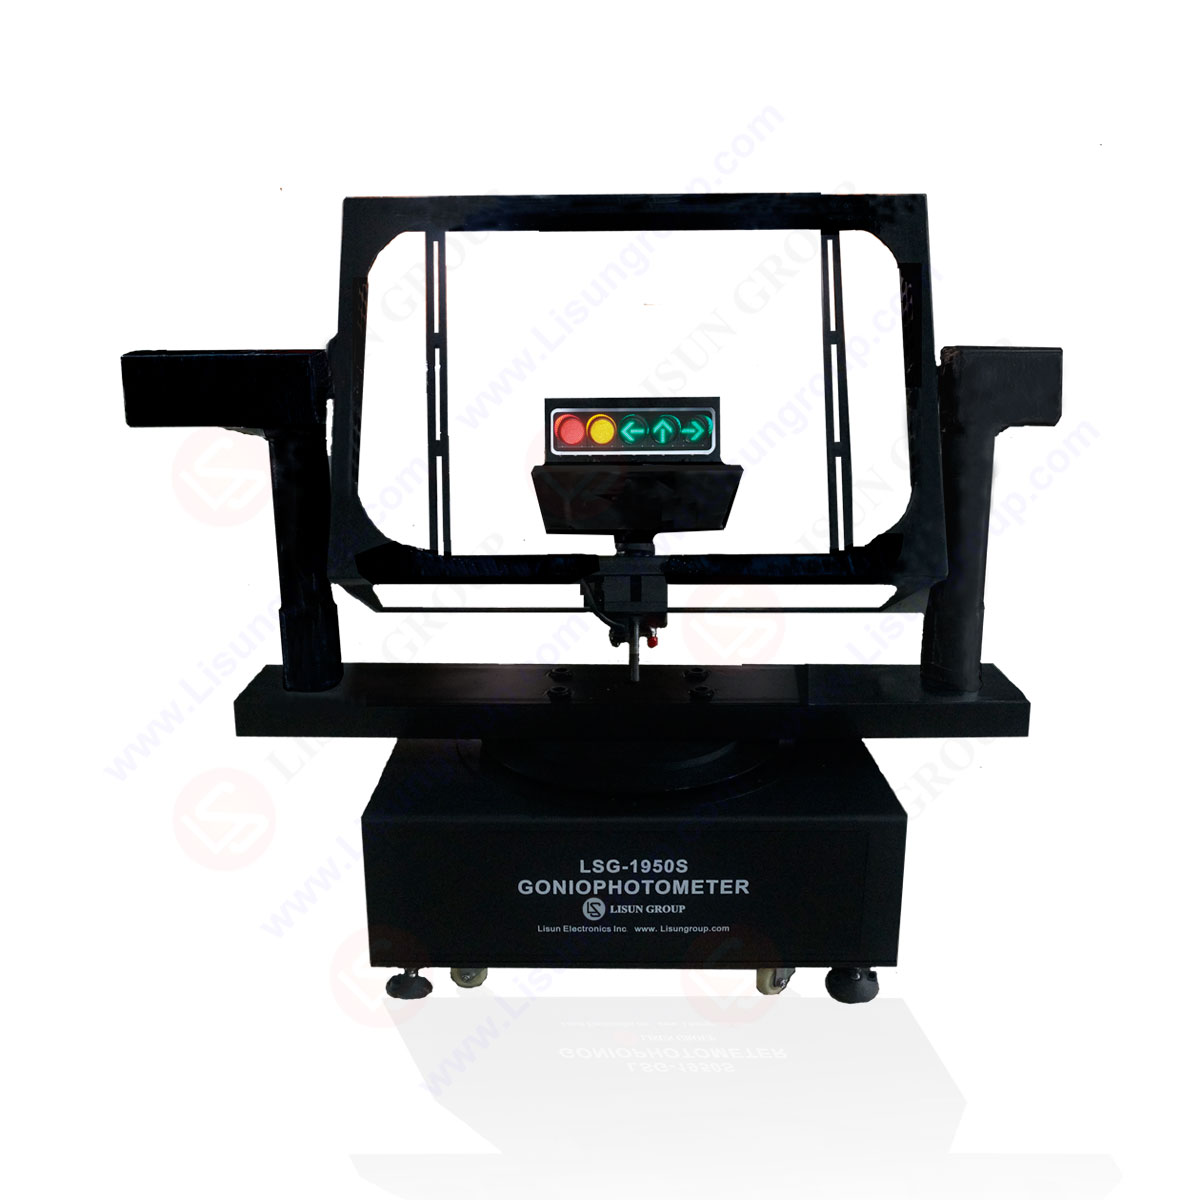
Goniophotometer for Traffic Signal Lamps
LSG-1950S
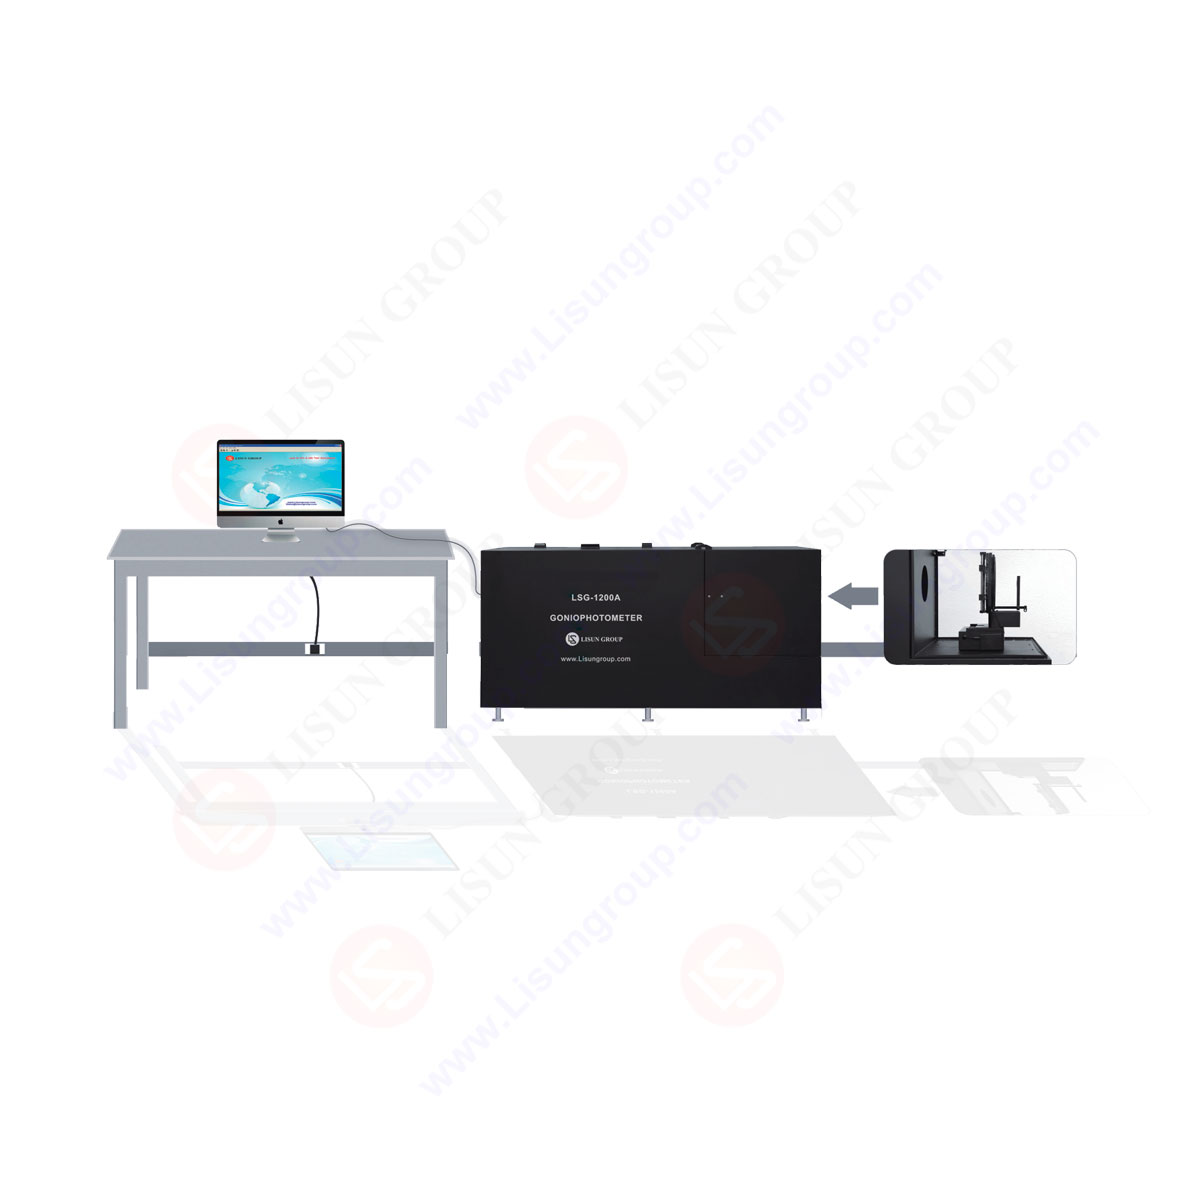
Compact Goniophotometer
LSG-1200A

Near Field Moving Detector Goniophotometer
LSG-1900B
Select an organization
to browse standards
Distribution gonio photometers typically come in two commonly used types: Lamp Turning Gonio Photometers and Mirror Turning Gonio Photometers. So what different report formats can their different uses output? Here is a brief discussion on “Uses of Gonio Photometers and Understanding of Lighting Curves”.
I. Gonio Photometer use
In recent years, semiconductor lighting technology has developed rapidly, and the corresponding semiconductor lighting luminaires have also seen great development. This requires corresponding detection theories, detection technologies, detection instruments and detection standards for the new products that appear. The distribution photometer is the core detection equipment for luminaires, usually divided into two types: Lamp Turning Distribution Goniophotometer, represented by the German L brand, and Mirror Turning Distribution Photometer, represented by the American LSI. Lamp-turning Distribution Photometer is mainly used to detect traditional lighting luminaires, requiring the luminaire’s light output to be insensitive to temperature and attitude changes; if the luminaire’s luminous flux changes significantly with temperature or attitude changes, this type of distribution goniophotometer is not suitable. Semiconductor lighting products are very sensitive to temperature, so lamp-turning distribution photometers cannot be used for measurement. The mirror-turning distribution photometer fixes the luminaire at the center of the measuring sphere, and the attitude of the luminaire will not change during the whole measuring process, with a rotating angle of only 360º and a constant height, which can meet the measurement of all types of luminaires. Especially for semiconductor lighting luminaires, the Mirror Turning Distribution Goniophotometer must be used for measurement according to the requirements of the LM-79 specification.
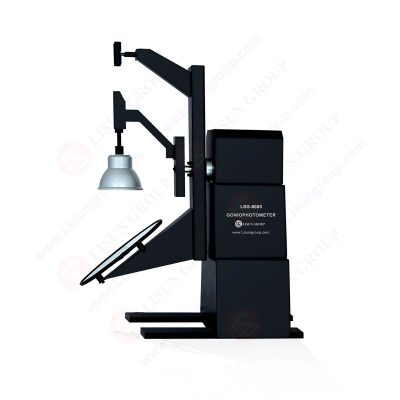
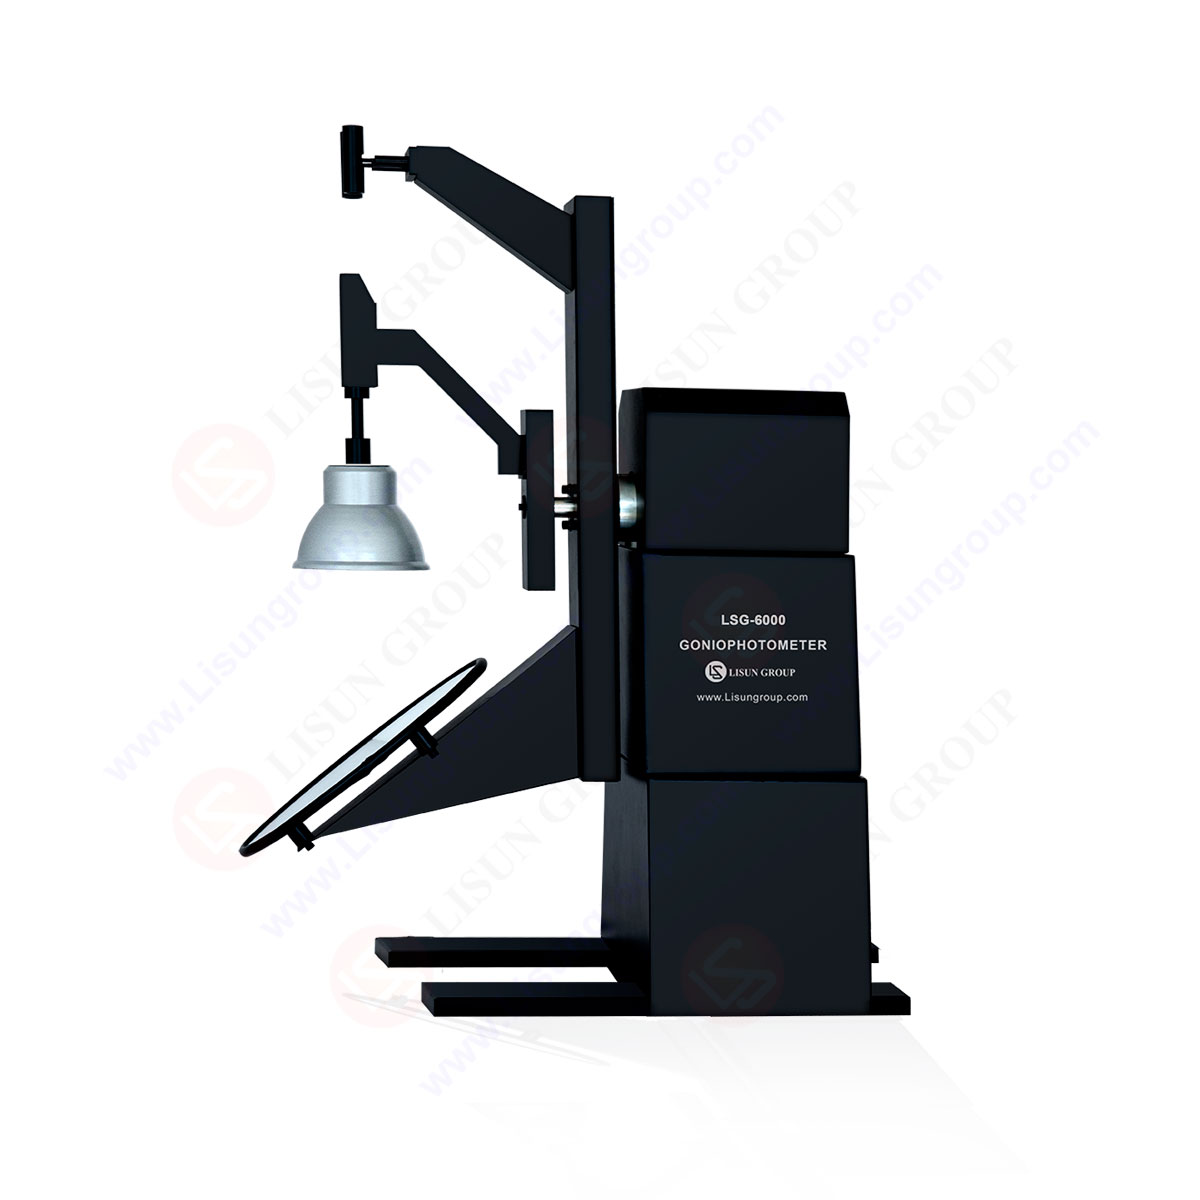
LISUN LSG-6000 Moving Detector Gonio Photometer (Mirror Type C) was manufactured by LISUN completely meets LM-79-19, IES LM-80-08, COMMISSION DELEGATED REGULATION (EU) 2019/2015, CIE-121, CIE S025, SASO 2902, IS16106 and EN13032-1 clause 6.1.1.3 type 4 requirements. LSG-6000 is the latest upgraded product of LSG-5000 and LSG-3000 in compliance with the requirements of the LM-79-19 standard Clause 7.3.1, its an automatic light distribution intensity 3D curve testing system for measuring light. The darkroom can be designed according to the customer’s existing room size.

LM-79 Moving Detector Goniophotometer (Mirror Type C)
The mirror-turning distribution gonio photometer is mainly used to measure the spatial distribution of light intensity and color of the luminaire, and to output various types of measurement reports according to the measurement results:
When a lamp is lit, its light output in the 4π space with the luminaire as the center of the sphere is not the same, that is, the light intensity at each point on a certain sphere is different. For each particular luminaire, in order to improve the efficiency of light output, it is always designed to have a specific beam distribution. The distribution goniophotometer uses a rotating mechanism, which is equivalent to moving a goniophotometer probe on a sphere with the same radius, thus measuring the light intensity at several points covering the whole sphere, and then using a certain algorithm to draw the light intensity distribution diagram, that is, the luminaire’s light model. By comparing the measured light distribution with the designed light distribution, improvement plans can be obtained, or it can be used as the basis for determining whether the test is qualified. In addition to the light intensity distribution diagram of the luminaire in the space, it is also necessary to have the color distribution diagram of the luminaire in the space, which is a clear requirement in the LM-79-08 standard. Color measurement and luminosity measurement are very different. Color measurement requires measurement of the entire visible spectrum and then color calculation, so a photometer cannot be used to measure color, but a spectrometer must be used. Usually, a CCD spectrometer is used to measure color. When color needs to be measured, the fiber probe is moved to the front of the photometer probe, and the reflecting mirror or luminaire is rotated step by step according to the set angle, so as to measure the color distribution of the luminaire at a certain point in the space.

II. Understanding of Illumination Curve
In general, we care most about whether this lamp can light up the places we want it to, and not where it shouldn’t. This can be described by the photometric curve in the photometer, which also explains why we need to measure the photometric curve. What is the photometric curve?
The photometric curve, also known as the luminous intensity distribution curve, is a curve that describes the spatial distribution characteristics of the light emitted by a light source or lamp.
Methods for representing the photometric curve:
1. Polar coordinate representation: This method is usually used to describe the light distribution of indoor and roadway lamps. It visually represents the light center of the lamp with the origin of the polar coordinates, uses certain vectors to represent the intensity of the light, and uses the angle of the polar coordinates to represent the angle between the light intensity vector and the light axis. The advantage of polar coordinate representation is that it is graphic and intuitive.
2. Rectangular coordinate representation: This method is usually used to describe the light distribution of floodlights and lamps or light sources with very narrow light distribution. Using the origin of the rectangular coordinates to represent the light center, the horizontal coordinates to represent the direction angle, and the vertical coordinates to represent the light intensity. The advantage of the rectangular coordinate representation is that it is convenient to view the light intensity values at different angles.
3. Coordinate system: The light flux emitted in different directions by various light sources and lamps is very different. The spatial map is best able to descriptively depict the characteristics of the light distribution. The photometer test method is to draw the light intensities measured in each direction on a spherical coordinate system as a series of vectors. Assuming the light source lies at the pole of the coordinate system, these vectors together constitute a “light distribution body”. The light intensity of lamps is usually measured in many planes. Among the various possible test planes, three plane systems have been proven to be particularly useful.
A-α plane:
A-plane Coordinate system description, as shown. The polar axis is in the vertical direction. The angles measured in the vertical half-plane are called α angles, and the vertical angle to the plane is the A angle. Use (A, α) coordinates to indicate a point on the sphere. α 0 ° is on the equator. The lamp aperture is usually aimed at the point (0,0), and the α 0 ° plane is perpendicular to the lamp aperture. The range of α angle is from -90 ° to 90 °. The range of A angle is from -180 ° to 180 °, -90 ° at the lowest point, and 90 ° at the highest point. Automobile lamp light intensity data is usually presented in the A-α plane coordinate system.
B-β plane:
B-plane coordinate system description, as shown. The polar axis is in the horizontal direction. The angles measured in the horizontal half-plane are called H angles, and the vertical angle to the plane is the V angle. Use (H,V) coordinates to indicate a point on the sphere. H 0 ° is on the equator. The lamp aperture is usually aimed at the point (0,0), and the V 0 ° plane is perpendicular to the lamp aperture. The range of H angle is from -90 ° to 90 °. The range of V angle is from -180 ° to 180 °, -90 ° at the lowest point, and 90 ° at the highest point. Floodlight light intensity data is usually presented in the B-β plane coordinate system.
C-γ plane:
In the C-plane coordinate system, the polar axis is vertical, as shown. The measure angle in the vertical half-plane is γ angle, and the horizontal angle to the half-plane is C angle. The light emitting aperture of the lamp is usually aimed at the (C0,γ0) point in the coordinate system. The range of γ angle is from 0 ° (lowest point) to 180 ° (highest point). The C plane in the angle range from 0 ° to 360 °, as shown. In photometry, the C 0 reference plane position is usually parallel to the auxiliary axial line of the lamp. The C-γ plane coordinate system is usually used for photometer test of indoor lighting and roadway lighting and has been widely accepted.
Lisun Instruments Limited was found by LISUN GROUP in 2003. LISUN quality system has been strictly certified by ISO9001:2015. As a CIE Membership, LISUN products are designed based on CIE, IEC and other international or national standards. All products passed CE certificate and authenticated by the third party lab.
Our main products are Goniophotometer, Integrating Sphere, Spectroradiometer, Surge Generator, ESD Simulator Guns, EMI Receiver, EMC Test Equipment, Electrical Safety Tester, Environmental Chamber, Temperature Chamber, Climate Chamber, Thermal Chamber, Salt Spray Test, Dust Test Chamber, Waterproof Test, RoHS Test (EDXRF), Glow Wire Test and Needle Flame Test.
Please feel free to contact us if you need any support.
Tech Dep: [email protected], Cell/WhatsApp:+8615317907381
Sales Dep: [email protected], Cell/WhatsApp:+8618117273997
LISUN’s indoor and outdoor LED test solutions meet IEC 60598-1, IEC 62722-2-1, CIE 121 standards, covering safety, photometry, and environmental tests for global compliance.

 中文简体
中文简体