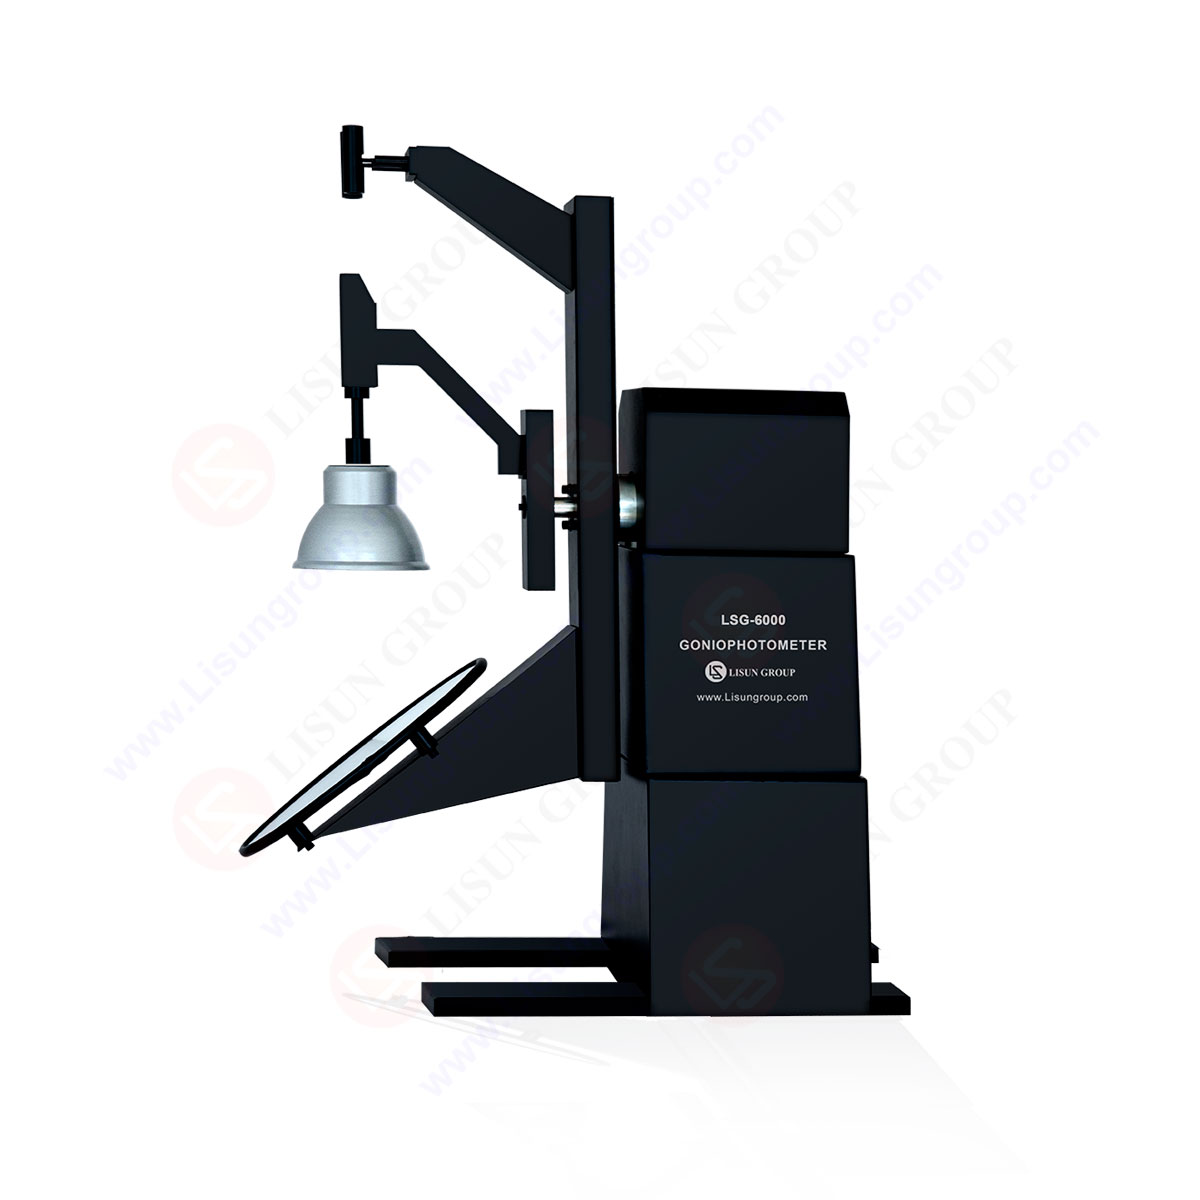
LM-79 Moving Detector Goniophotometer (Mirror Type C)
LSG-6000
High Precision Rotation Luminaire Goniophotometer
LSG-1890B
High Precision Rotation Luminaire Goniospectroradiometer
LSG-1890BCCD
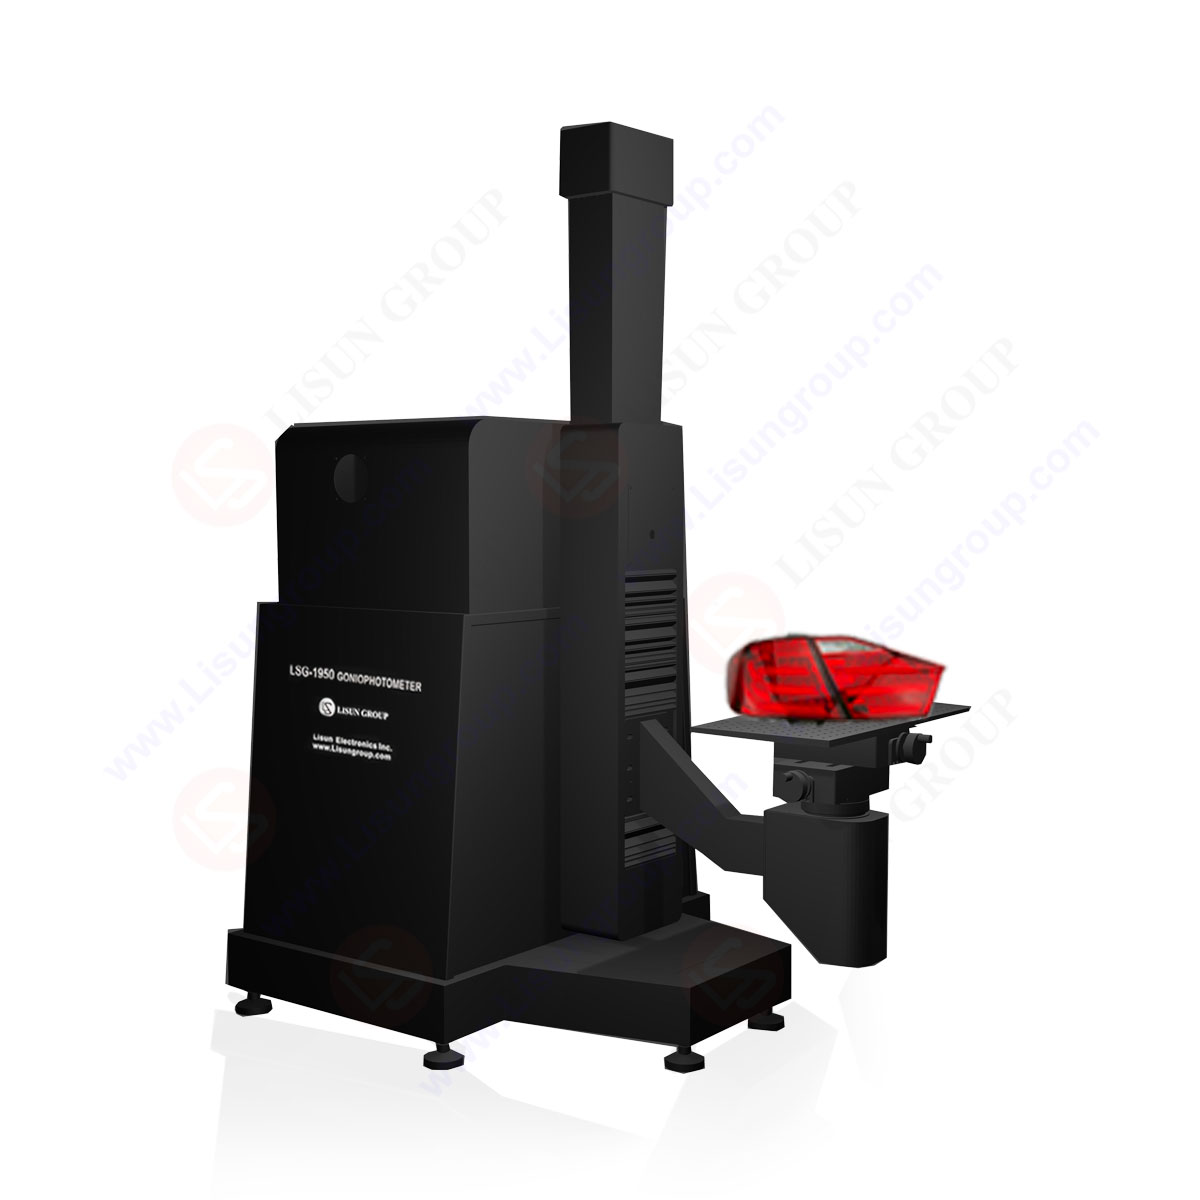
Goniophotometer for Automotive and Signal Lamps
LSG-1950
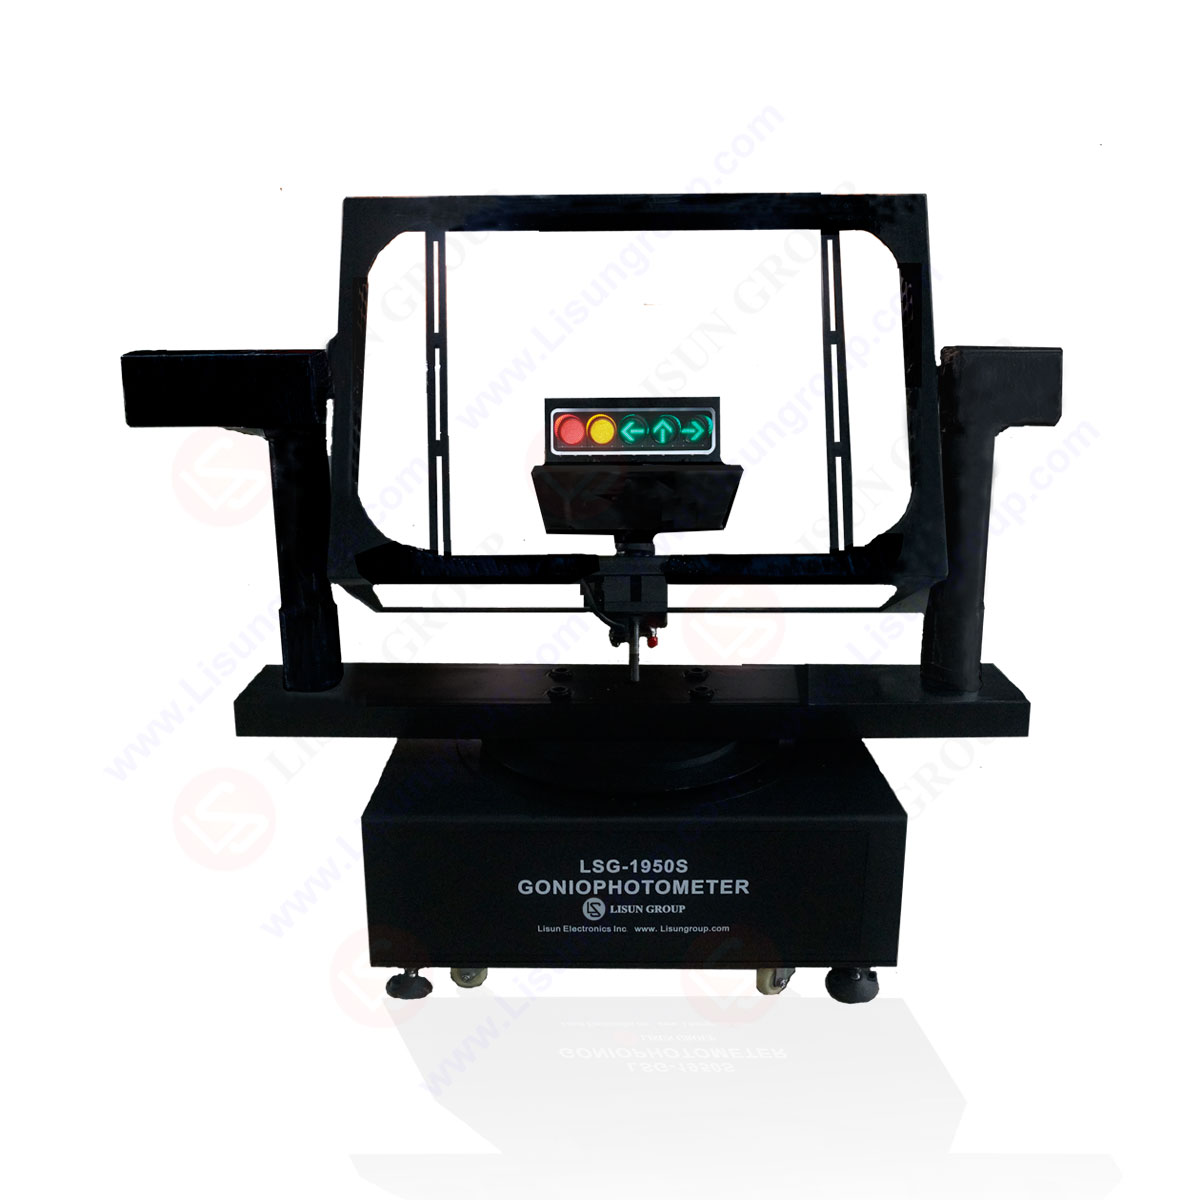
Goniophotometer for Traffic Signal Lamps
LSG-1950S
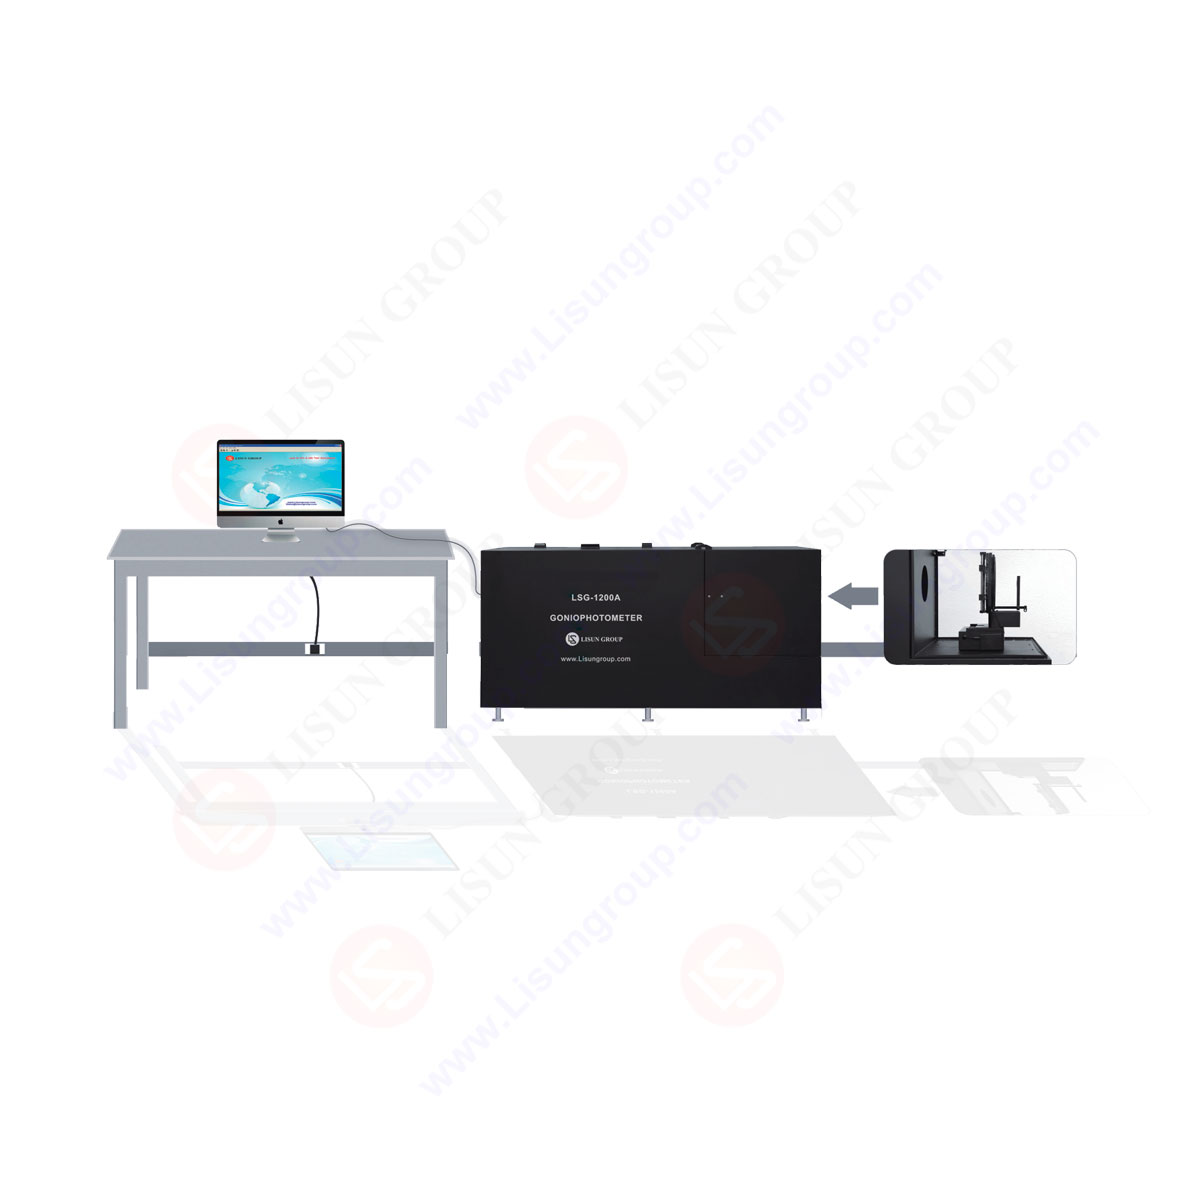
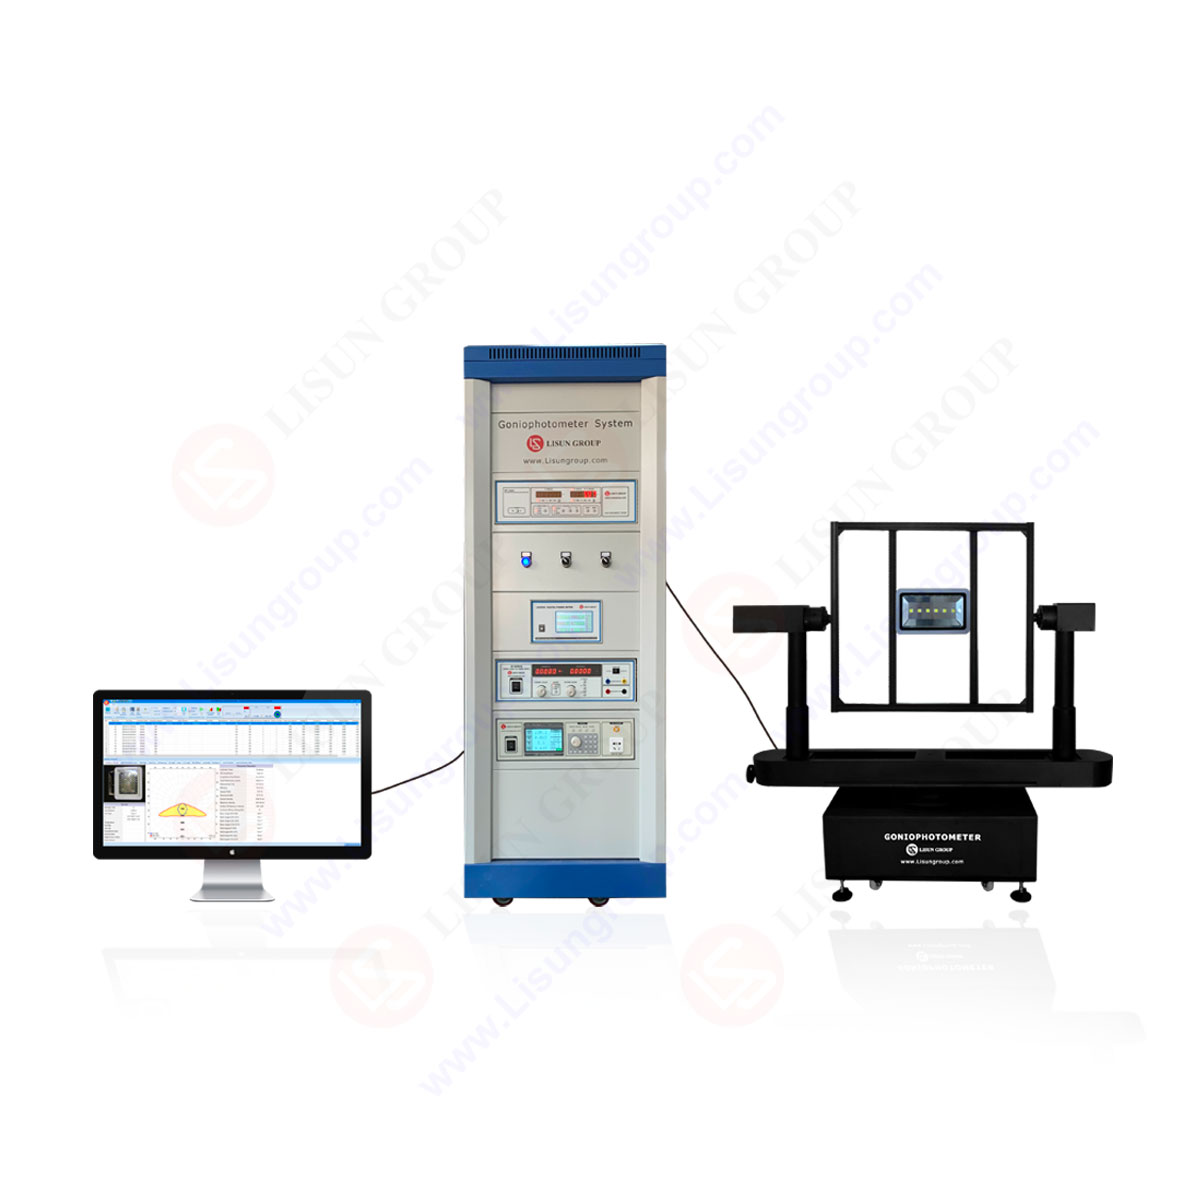
Compact Goniophotometer
LSG-1200A

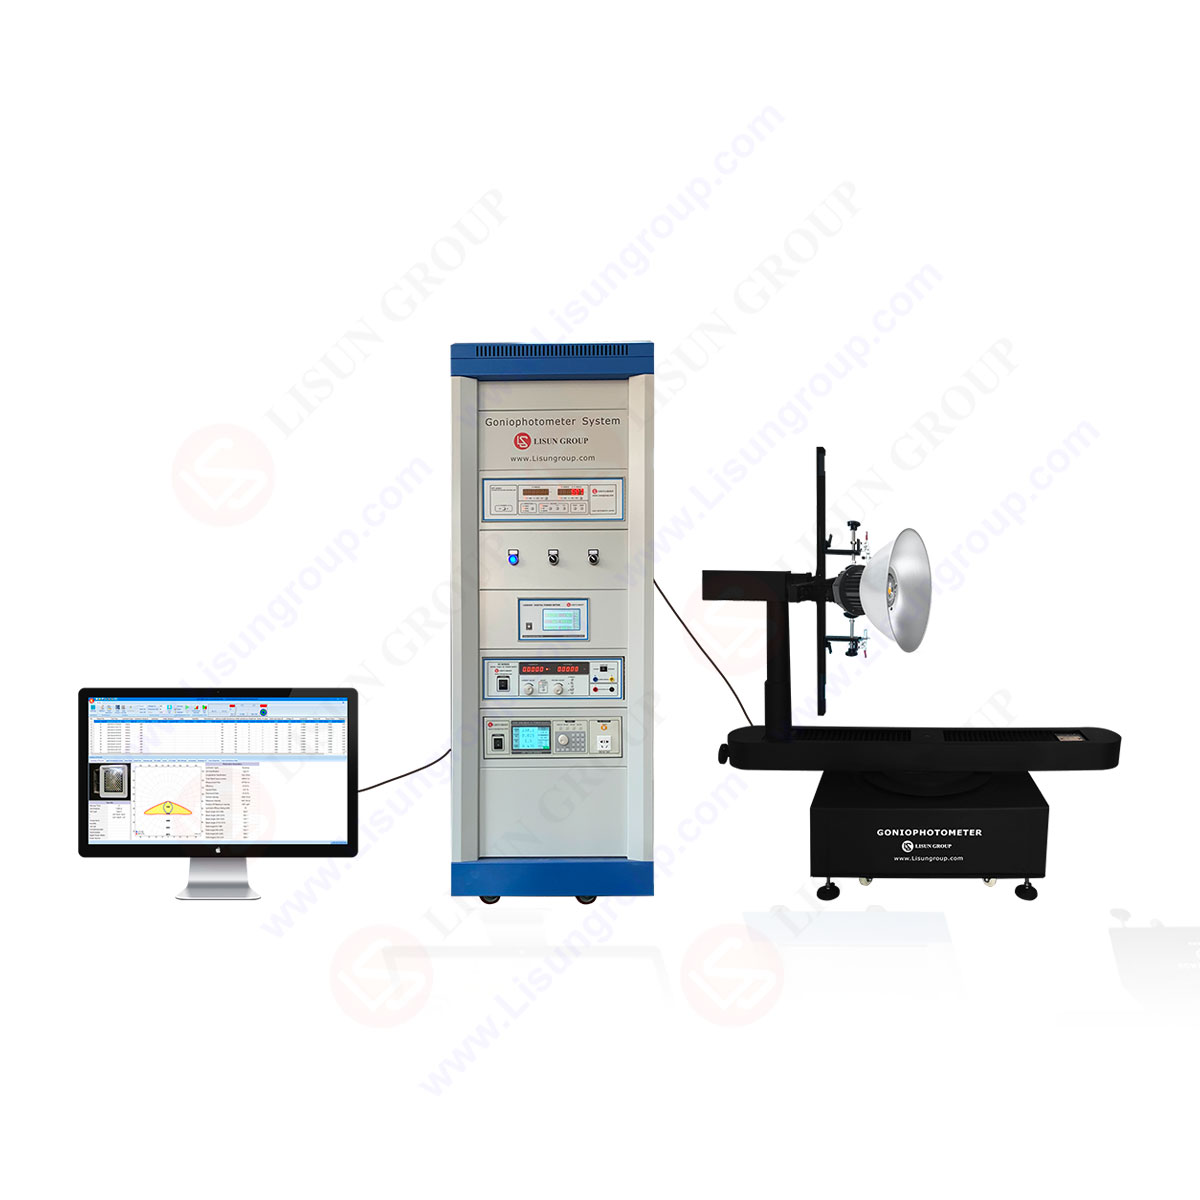
Near Field Moving Detector Goniophotometer
LSG-1900B
Select an organization
to browse standards
Whiteness is the attribute of high reflectivity and low saturation (purity) of color. White is a color group, which is in the narrow range of 470~570 nm in the main wave length. Generally, its brightness y>70, and its excitation purity Pe<0.1. Although white is not a single color (monochrome), most observers can still arrange the order according to the different spectral reflectance, excitation purity and main wavelength of the white sample and the difference of whiteness. For a given group of white samples, their arrangement order will not only vary with different observers, but also with different results if the same observer is evaluated by different methods.

White Paper
On the other hand, the evaluation of the whiteness of the sample is also related to the preferences of the observer. For example, some prefer white with red light, some prefer white with blue light, and some observers prefer white with green light. The individual preferences of observers are different.
In addition, the evaluation result of whiteness is also closely related to the change of observation conditions. When observing the same sample under different brightness or light source with different spectral power distribution, different results will appear. In actual production, there are two common evaluation methods of whiteness. One is colorimetry, which is to compare the measured sample with the standard sample with known whiteness. Another method is to use a whiteness measuring instrument to measure.
Many whiteness calculation formulas have been stored in the instrument. When measuring, the instrument automatically calculates the whiteness value by selecting the corresponding whiteness formula according to the user’s settings. This method has objective evaluation results because of objective evaluation conditions.
1. Calculation formula of whiteness based on ideal whiteness
This kind of calculation formula is essentially to calculate the color difference between sample white (sample color) and ideal white.
①. Hunter whiteness formula
This formula is to define the whiteness of the fully reflective diffuser as 100, compare the whiteness of the sample with the whiteness of the fully reflective diffuser, and evaluate the whiteness of the sample by calculating the color difference.
In the formula, L, a, b are the brightness index and chromaticity index of the sample in the Lab system, k1 is a constant, and generally the value is 1.
Ap, bP is the whiteness index of ideal white in the Lab system,
Normally:
When measuring the sample without fluorescence, ap=0.00, bP=0.00;
When measuring the sample with fluorescence, ap=3.50, bP=-15.87:
②. CIE1982 whiteness evaluation formula (Ganz whiteness formula)
CIE1982 whiteness evaluation formula is a formula for evaluating whiteness recommended by the International Lighting Committee so far. This formula was put forward by EGanz of Ciba-Lengji Company in Switzerland. It has three expressions.
1. Take blue with green as favorite white,
2. Take blue with red as favorite white,
3. Neutral colorless is preferred white.
Where, x0, y0 are the chromaticity coordinates of ideal white in a 2 degree field of view, and Y, x, y are the brightness index and chromaticity coordinates of the sample; The greater the whiteness of W in a 2 degree field of view, the greater the whiteness of the sample; Tw is the sample tone shift value (light tone value, that is, some tone value with white slightly) in a 2 degree field of view. Tw > 0 indicates that the sample is green, and the larger the value is, the more green it is; Tw < 0 indicates that the sample is red, and the larger its absolute value is, the more red it is.For a completely diffuse reflector, W=100, Tw=0.
2. The whiteness measurement formula derived on the basis of reflectivity measurement of experimental samples
1. Single-band whiteness formula
There are two whiteness formulas expressed by the reflectance of a certain spectral region.
①. Use W to represent the whiteness and G to represent the reflectance of green light, that is, use the reflectance of green light to represent the whiteness of the sample.
②. Use R457 to represent the reflectance corresponding to blue light, that is, use the reflectance of blue light to represent the whiteness of the sample.
In the paper industry, the International Organization for Standardization (ISO) uses a blue light with a main wavelength of 457.0 nm ± 0.5 nm and a half-peak width of 44 nm to measure the reflectance of the sample. The reflectance of the short-wavelength region and R457 are used to express the whiteness, which is called ISO whiteness or blue whiteness.
2. Multi-band whiteness formula
There are two whiteness formulas to express the whiteness of the sample by the reflectance and its coefficient in a specific wavelength range.
①. Aluminum ratio (Taube) formula.
The whiteness is expressed by the difference between the blue reflectance B and the green reflectance G multiplied by a coefficient.
W=4B-3G
②. The whiteness is expressed by the yellowness index.
In the formula, A, G and B correspond to the reflectance of red, green and blue bands respectively, which is the reflectance detected by the red, green and blue detectors corrected by the corresponding filter. They can be calculated from the tristimulus value of the sample color:
These two kinds of formulas have their own advantages and disadvantages. The first type is derived from taking Love White as a complete diffuse reflector, and it is difficult to correctly evaluate the sample with fluorescent brightener. The two formulas mentioned above are used to calculate the whiteness of the sample with fluorescent brightener by introducing empirical coefficient in the formula, so the calculation results are also approximate. As for the second type of formula, the more serious the blueness of the sample, the greater the whiteness value obtained, which is inconsistent with the actual situation. However, it is very suitable for calculating the whiteness of the sample with fluorescent brightener.
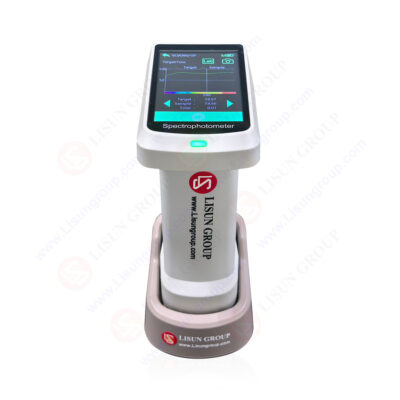
LISUN lauched HSCD-860 Innovative 5-micron-thick nano-integrated optical device innovation is the soul. After nearly 10 years of painstaking research, the instrument uses nano-integrated optical devices as spectroscopic devices, and only 5 microns thick optical devices can achieve nano-level spectroscopic capabilities, once again leading the direction of industry innovation and surpassing the technology of foreign products. The blockade has greatly improved the technical performance of the product.

HSCD-860 Portable Spectrophotometer
Lisun Instruments Limited was found by LISUN GROUP in 2003. LISUN quality system has been strictly certified by ISO9001:2015. As a CIE Membership, LISUN products are designed based on CIE, IEC and other international or national standards. All products passed CE certificate and authenticated by the third party lab.
Our main products are Goniophotometer, Integrating Sphere, Spectroradiometer, Surge Generator, ESD Simulator Guns, EMI Receiver, EMC Test Equipment, Electrical Safety Tester, Environmental Chamber, Temperature Chamber, Climate Chamber, Thermal Chamber, Salt Spray Test, Dust Test Chamber, Waterproof Test, RoHS Test (EDXRF), Glow Wire Test and Needle Flame Test.
Please feel free to contact us if you need any support.
Tech Dep: Service@Lisungroup.com, Cell/WhatsApp:+8615317907381
Sales Dep: Sales@Lisungroup.com, Cell/WhatsApp:+8618117273997

 中文简体
中文简体