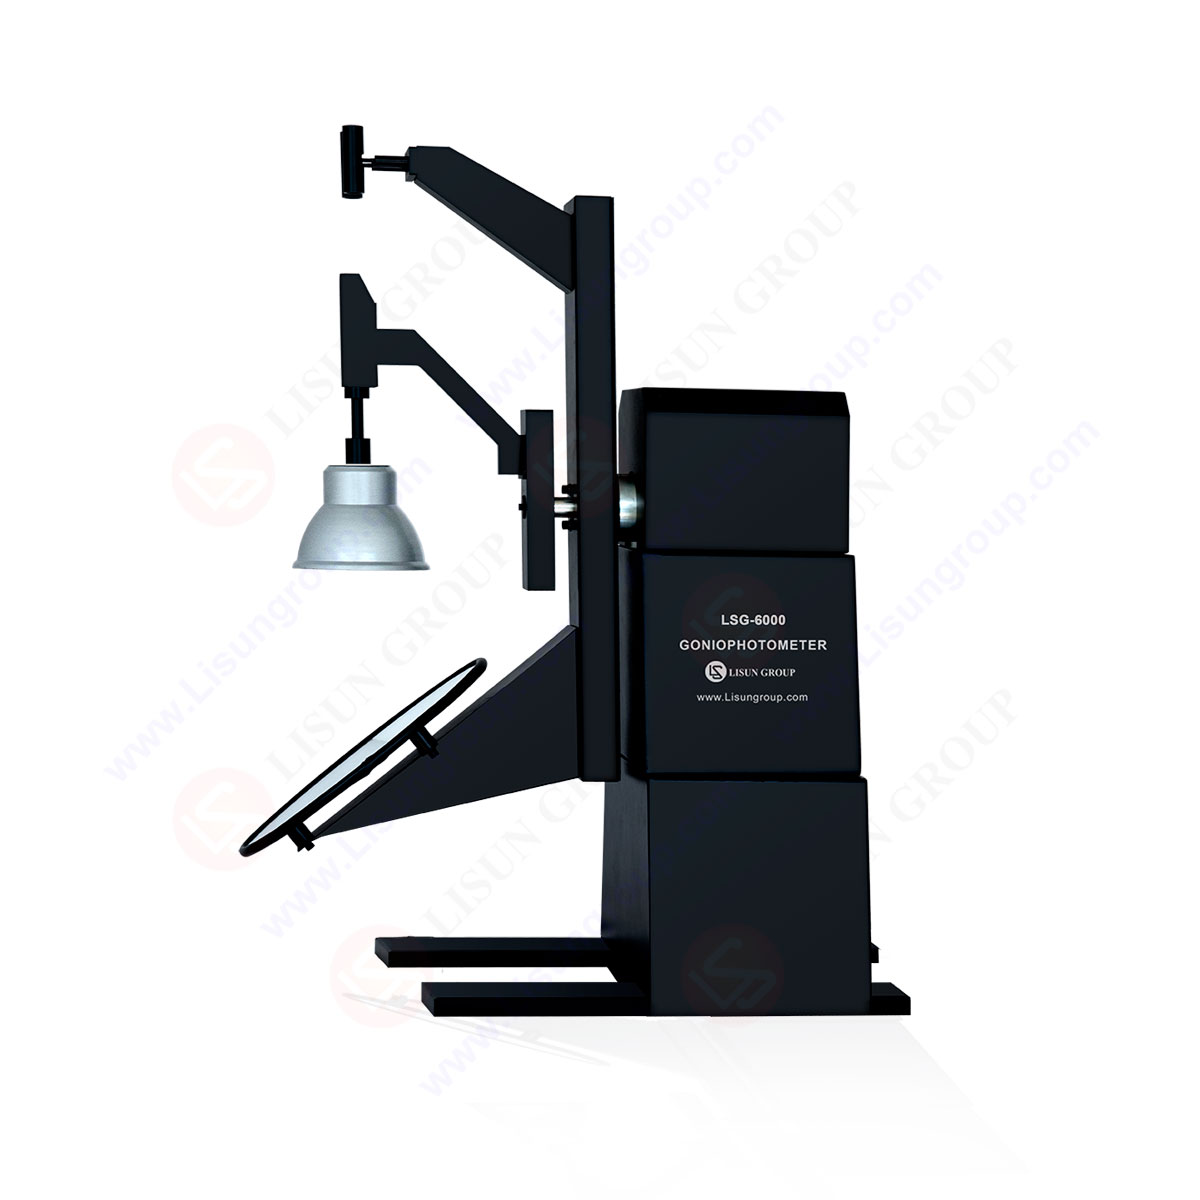
LM-79 Moving Detector Goniophotometer (Mirror Type C)
LSG-6000
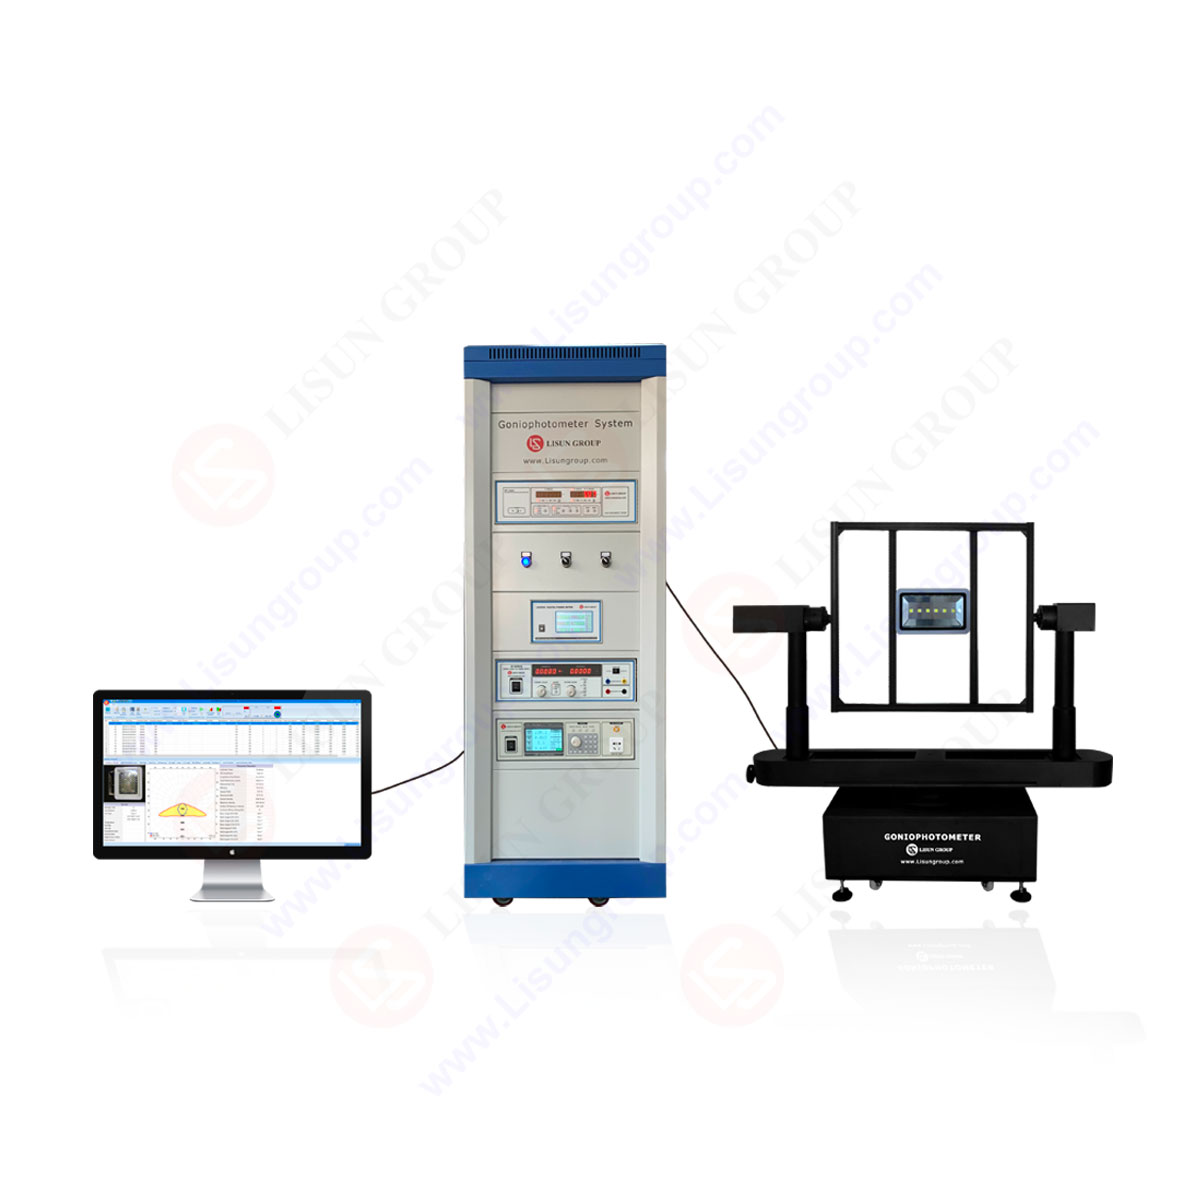
High Precision Rotation Luminaire Goniophotometer
LSG-1890B
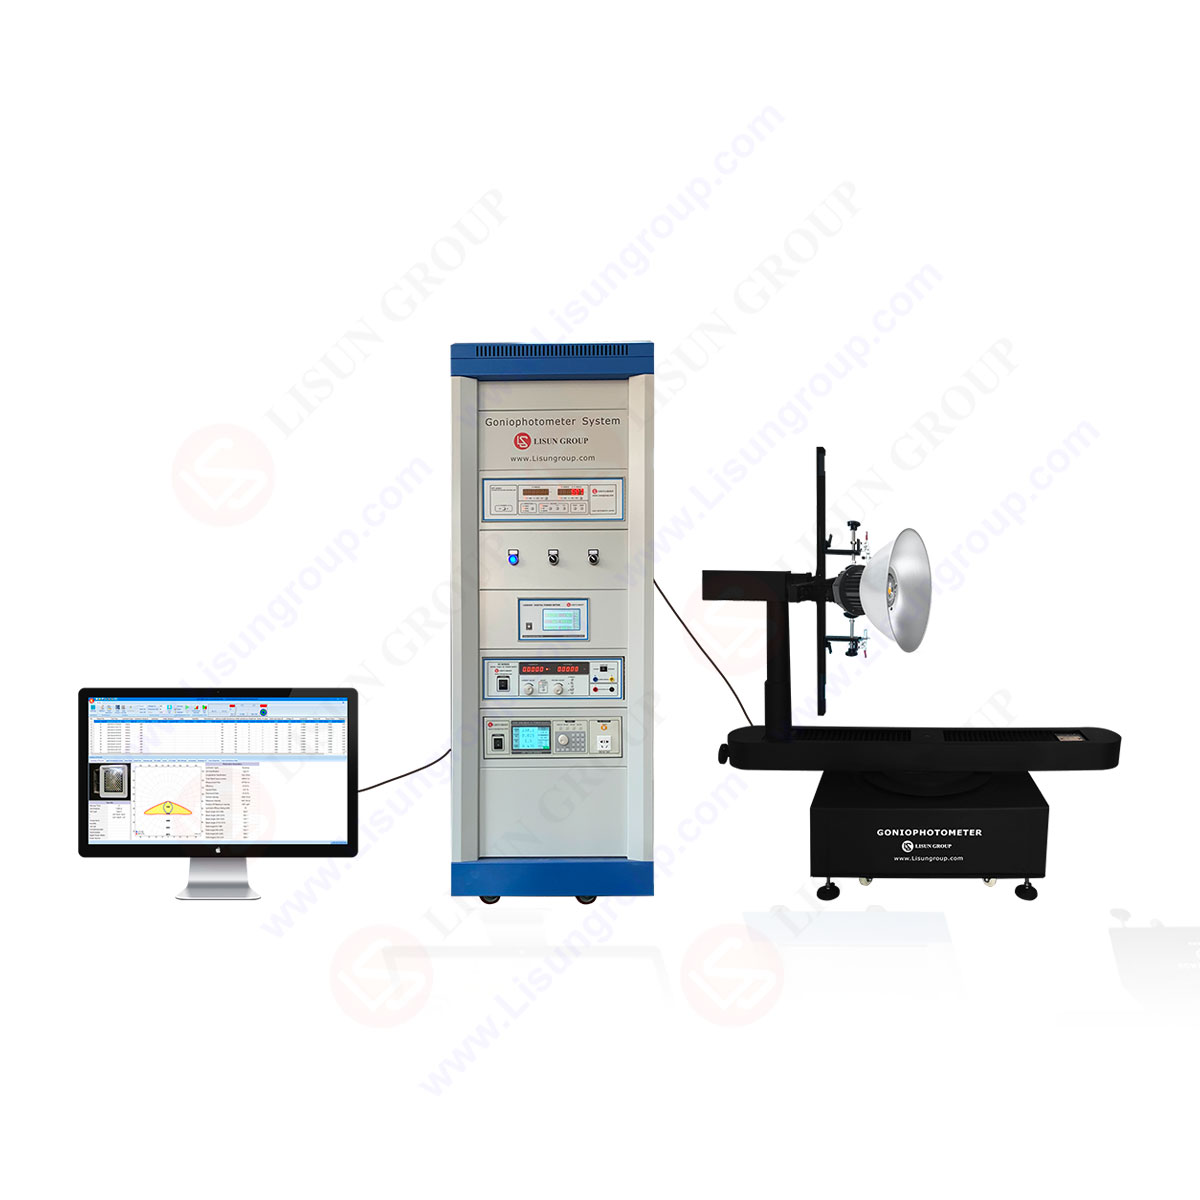
High Precision Rotation Luminaire Goniospectroradiometer
LSG-1890BCCD
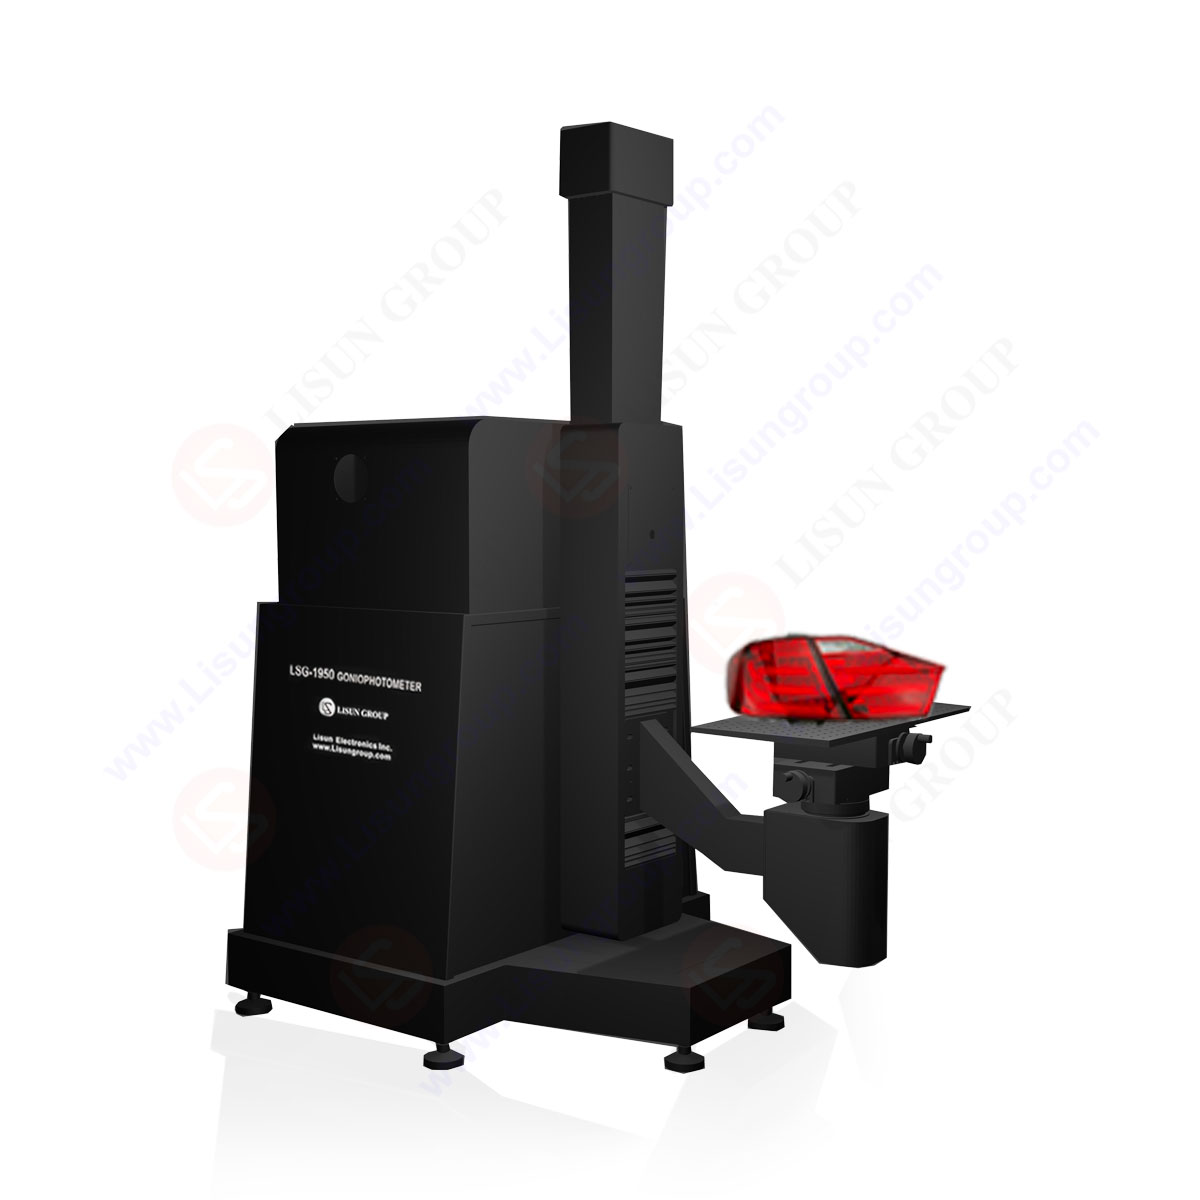
Goniophotometer for Automotive and Signal Lamps
LSG-1950
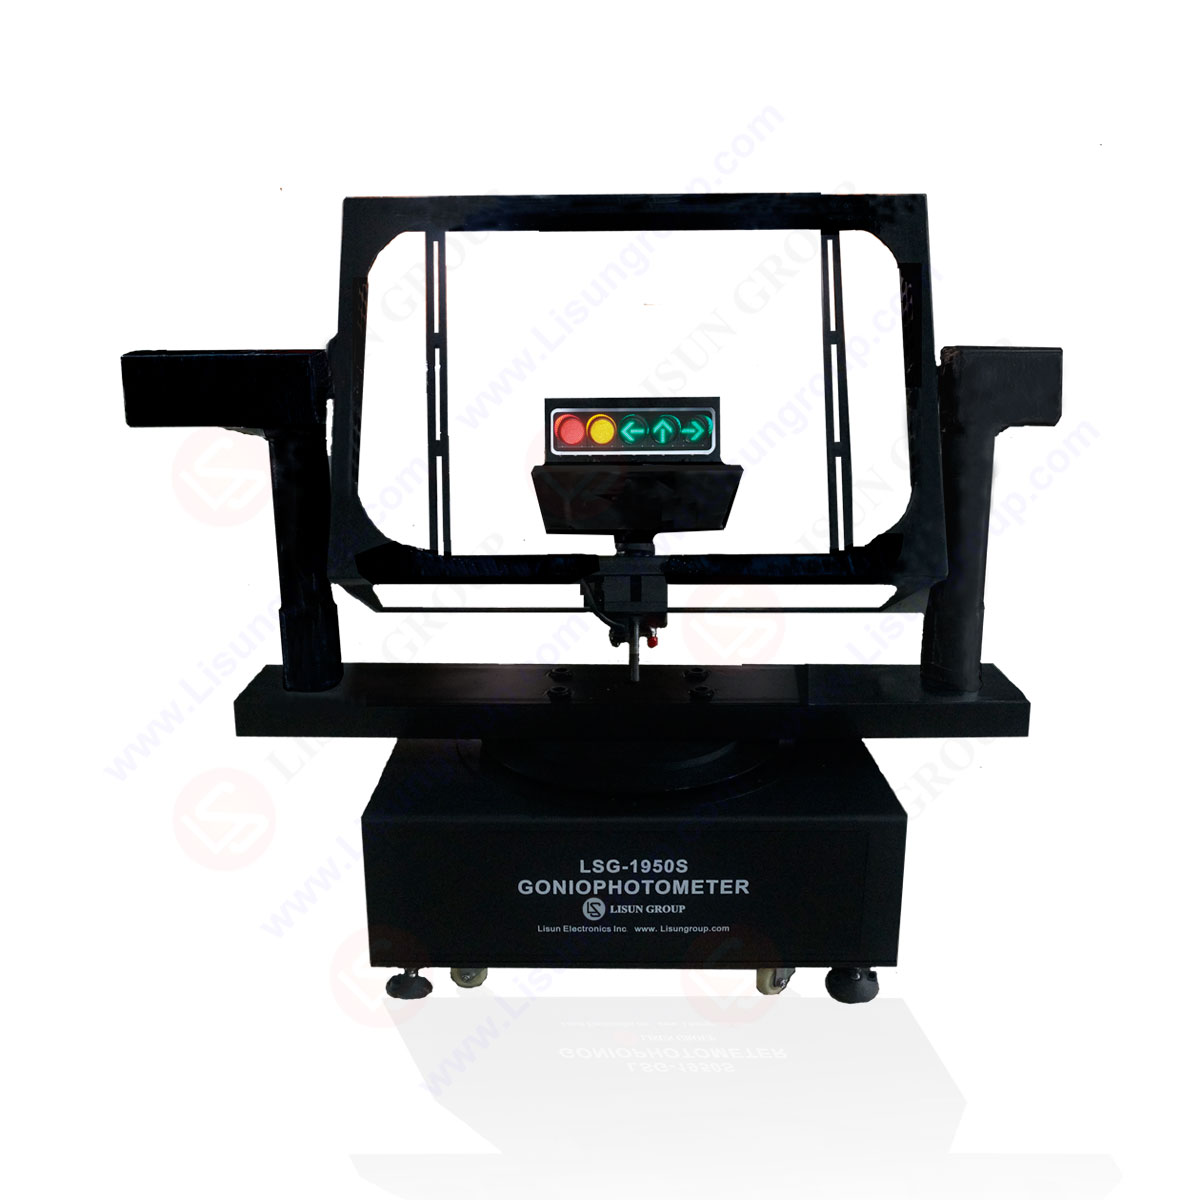
Goniophotometer for Traffic Signal Lamps
LSG-1950S
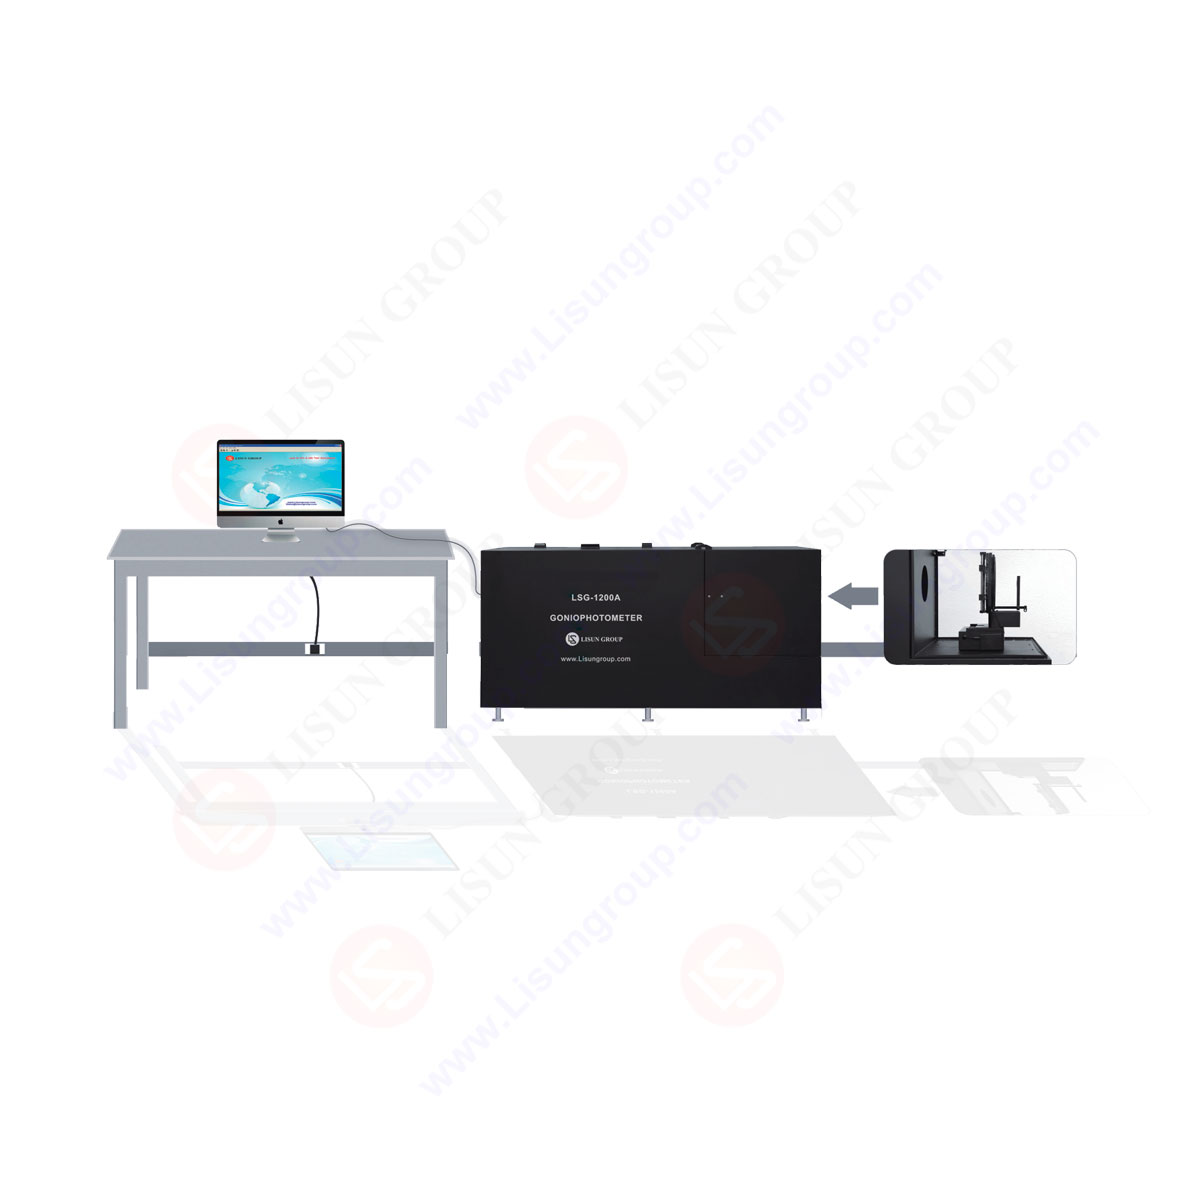
Compact Goniophotometer
LSG-1200A

Near Field Moving Detector Goniophotometer
LSG-1900B
Select an organization
to browse standards
Goniophotometer testing is the most prevailing way of attaining total three dimensional photometric characterization of luminaires and light source. In contrast to the simplified measurements which only report the total luminous flux or average illuminance, this method has the advantage to measure the light distribution in space at all relevant angles. In the case of the modern lighting system with complicated optics asymmetric beams and application dependent distributions, in order to design validate that simulation and even satisfy regulation, there is a need to measure light intensity in three dimensions. The data obtained is only the assessment of whether the resulting data is truly reflecting real world performance or simply a laboratory artifact through proper testing procedures.
A goniophotometer defines the luminous intensity by turning either the luminaire or the detector over specified angular axes but at a specified distance between the luminaire and receiver. The geometry that is adopted defines the attainability of spatial distribution by the system. Most frequently, type C systems are used as general lighting due to their rotation of the luminaire around two axes which are orthogonal and the detector is held stationary. This design assists to build far field conditions and is easy to interpret the data of majority of indoor outdoor and roadway luminaries.
Mechanical alignment of the system has to be done before the system is tested. The luminaire photometric center must match with rotational center of goniophotometer. Misalignment causes angular errors which bend the intensity distribution particularly in small beam optics. The mounting fixtures should be hard and reproducible to ensure that the results between the samples do not vary in case of repositioning. Supplier-provided professional systems often have customizable mounting accessories and alignment aids to minimize the uncertainty in setup.

Labeling to achieve accurate 3D photometric characterisation it is necessary that the luminaire should be operated in constant electrical and thermal conditions. Light sources (LEDs) and discharge sources show changes in output during warm up such that the experiment mentality is to have a stabilization period until the light is produced at steady state. This time is subject to the design of thermal mass drivers and heat sinking, but not guessing.
There should be constant monitoring of electrical input parameters. The voltage current power and frequency must be in condition, and must not exceed tolerance during the test. Any variation has a direct impact on luminous intensity and has the potential of inducing angular effects in case the output changes over the course of scanning. High power luminaires Thermal sensors at certain points of temperature of the case can be used to verify the stability prior to and during measurement.
The conditions of the photometric laboratory also comprise environmental conditions. Detectors are affected by temperature difference in the airflow and reflections. Tests must be conducted under controlled dark conditions where ambient temperature is constant and air movement is minimal to prevent the cooling effect which may change the amount of light being produced during a lengthy scan.
Angular scanning procedure is the central component of goniophotometer testing. The system would be required to cover the vertical and horizontal angles and a specified grid would be used to attain the required three-dimensional coverage. Angular resolution should be high enough to resolve sharp intensity gradients that are formed at a secondary optics reflector or lens.
The speed of scan also has an effect on data quality. A very quick rotation may lead to lag of the detector during rotation or mechanical vibrating when very slow scans make the test taking time too long and may also lead to thermal drift. Optimized processes strike a balance between the speed and stability of resolutions. Contemporary scan systems have programmable scan patterns which concentrate greater resolution to areas of rapid intensity change at the expense of coarser steps in other areas so as to lower the total time.
Detector should be spaced far enough that fulfills a far field condition. This will also make the angular distribution independent of distance. The distance needed will vary depending on the largest luminous size of the source and the optical design. Ensuring far field compliance is an essential step procedure since the close-range measurements of this field bendiness and nullify any correlation to the normal photometric files.
Even though most goniophotometers record the luminous intensity it is common to combine spectroradiometers to record spectral data at specific angles. This has become more essential to LED luminaires with color change in the beam potentially influencing the visual comfort and the practicability of the use. In multi-chip design or narrow beam setup, the color shift of angular in beam cannot be obvious in total flux measurement but is clear in 3D characterizations.
Spectral data can be used to obtain colorimetric parameters, including correlated color temperature chromaticity coordinates and color rendering measures of image appearance versus angle. This information when used together with light intensity measure give a more detailed account of luminaire behavior especially in architectural and roadway lighting where off axis light makes up a considerable proportion of perceived quality.
Unprocessed goniophotometric data should be converted to the standardized formats to be used in practice. Detector sensitivity values and angular position values are then corrected and then combined into a photometric file like IES and EULUMDAT. Lighting designers use these files to simulate the effect of illuminance luminance and glare in actual installations.
Validation is a necessary procedure. Cross tests of integrating sphere flux measurements serve to verify the result of using the measured intensity distribution that the total sum of the luminous flux is constant. The great differences to show errors are adjustment problems during setup or problems with detectors. Repeatability can also be determined by repeating some of the selected angular slices or by making bidirectional scans.
Final results should be supported by uncertainty analysis. Detector calibration angular resolution alignment repeatability and electrical stability are some of the contributors. Recording uncertainty enables the consumer of the data to make judgment on its confidence and also makes it possible to file compliance reports.
The last step of goniophotometer testing is interpretation. The 3D photometric data depicts the cutoff behavior of beam shapes and position of peak intensities which have a direct impact on the performance of application. In road way lighting it identifies uniformity and glare. In case with indoor lighting it touches upon spacing criteria as well as on the visual comfort. In specialized optics it proves that the design intent is fulfilled.
A concise report of test conditions including mounting of the orientations of electrical input stabilization time and environmental conditions should be provided. Polar plots and heat maps of intensity are used to convey complicated three-dimensional information to non-experts graphically. The presence of raw data with processed files is a way of ensuring traceability and also makes possible re analysis of these data in future when standards change.
The photometric characterization of three-dimensional objects requires a set of goniophotometer testing and not equipment. The data of light intensity measurements require a lot of accuracy and the thermal and electrical stabilization of the scanning and the strict validation to generate accurate light intensity data. By employing these procedures on well-developed systems and accessories like those offered by LISUN laboratories are capable of providing photometric data which is a true belief to actual world operation and which can promote and instil assurance to lighting design certification and innovation.
Tags:LSG-6000Your email address will not be published. Required fields are marked *

 中文简体
中文简体