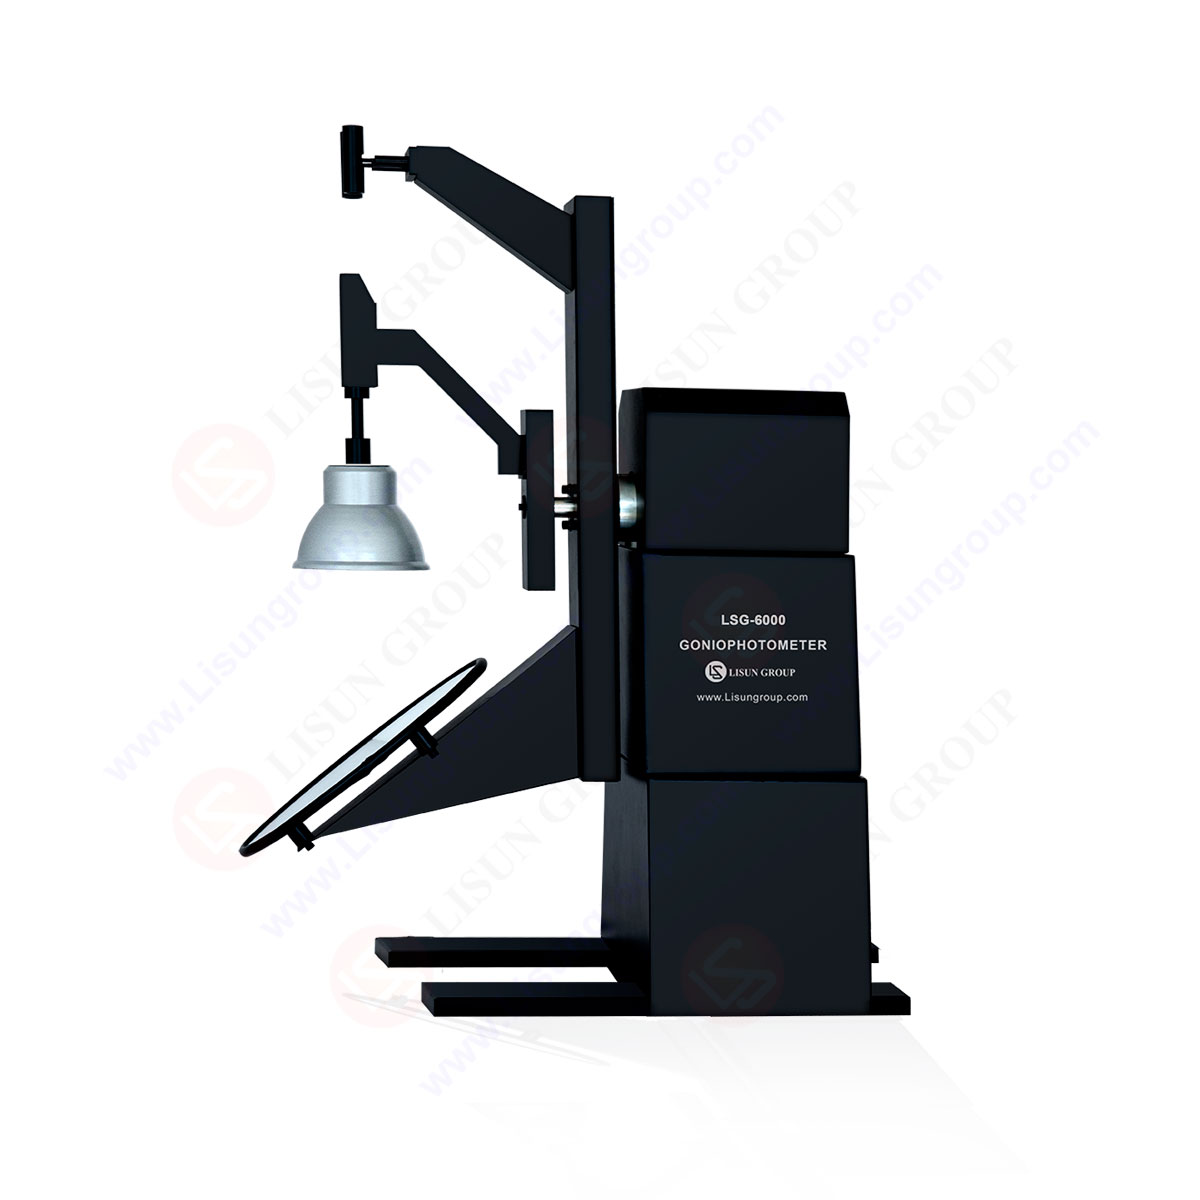
LM-79 Moving Detector Goniophotometer (Mirror Type C)
LSG-6000
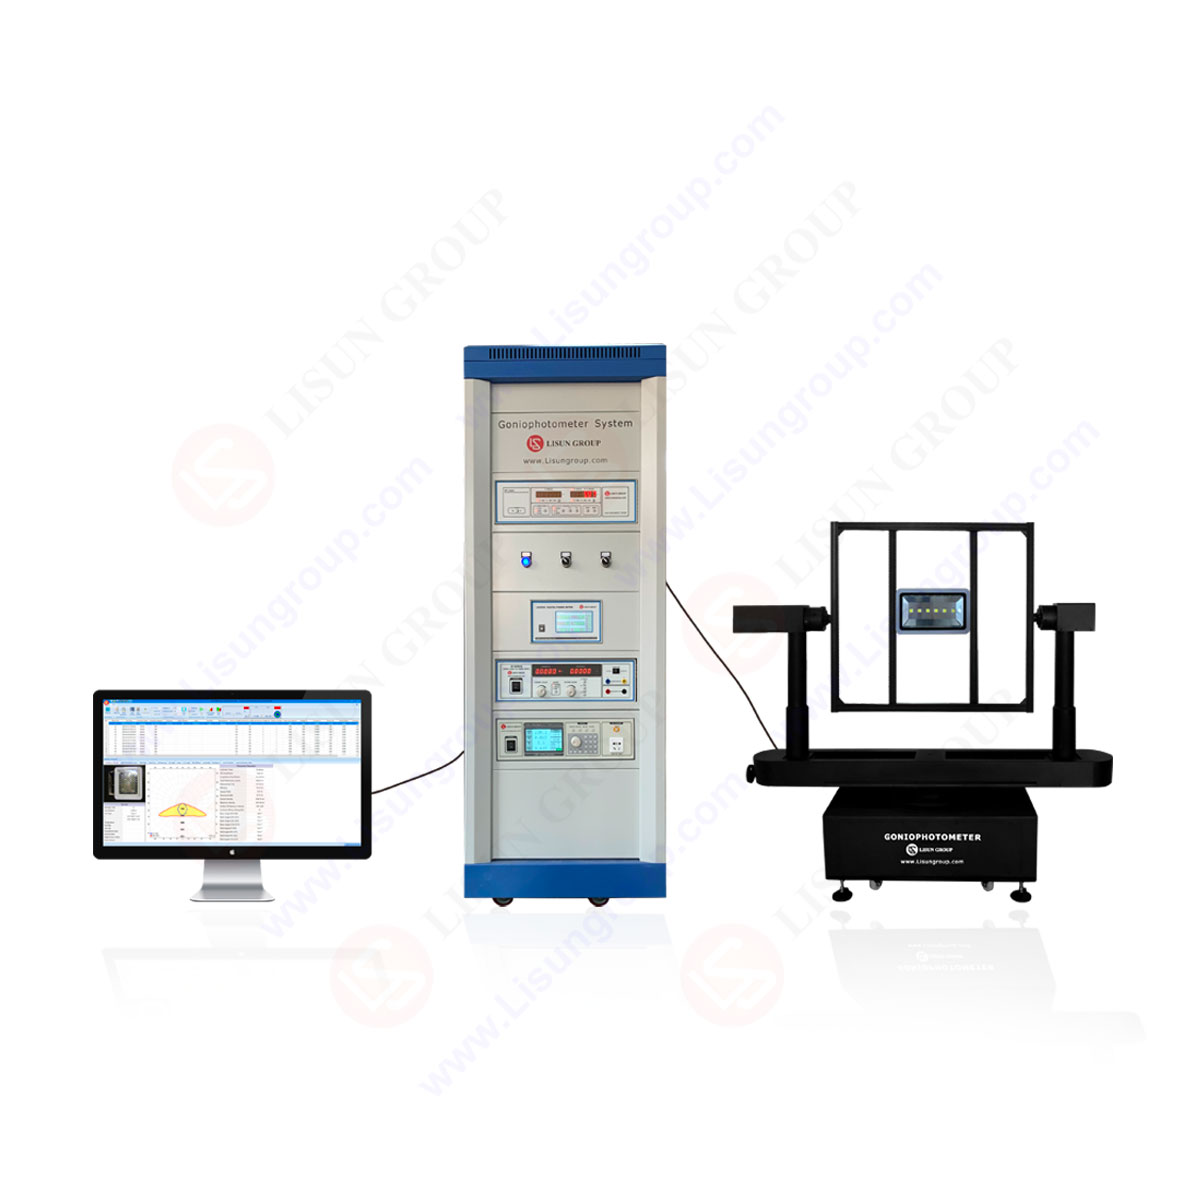
High Precision Rotation Luminaire Goniophotometer
LSG-1890B
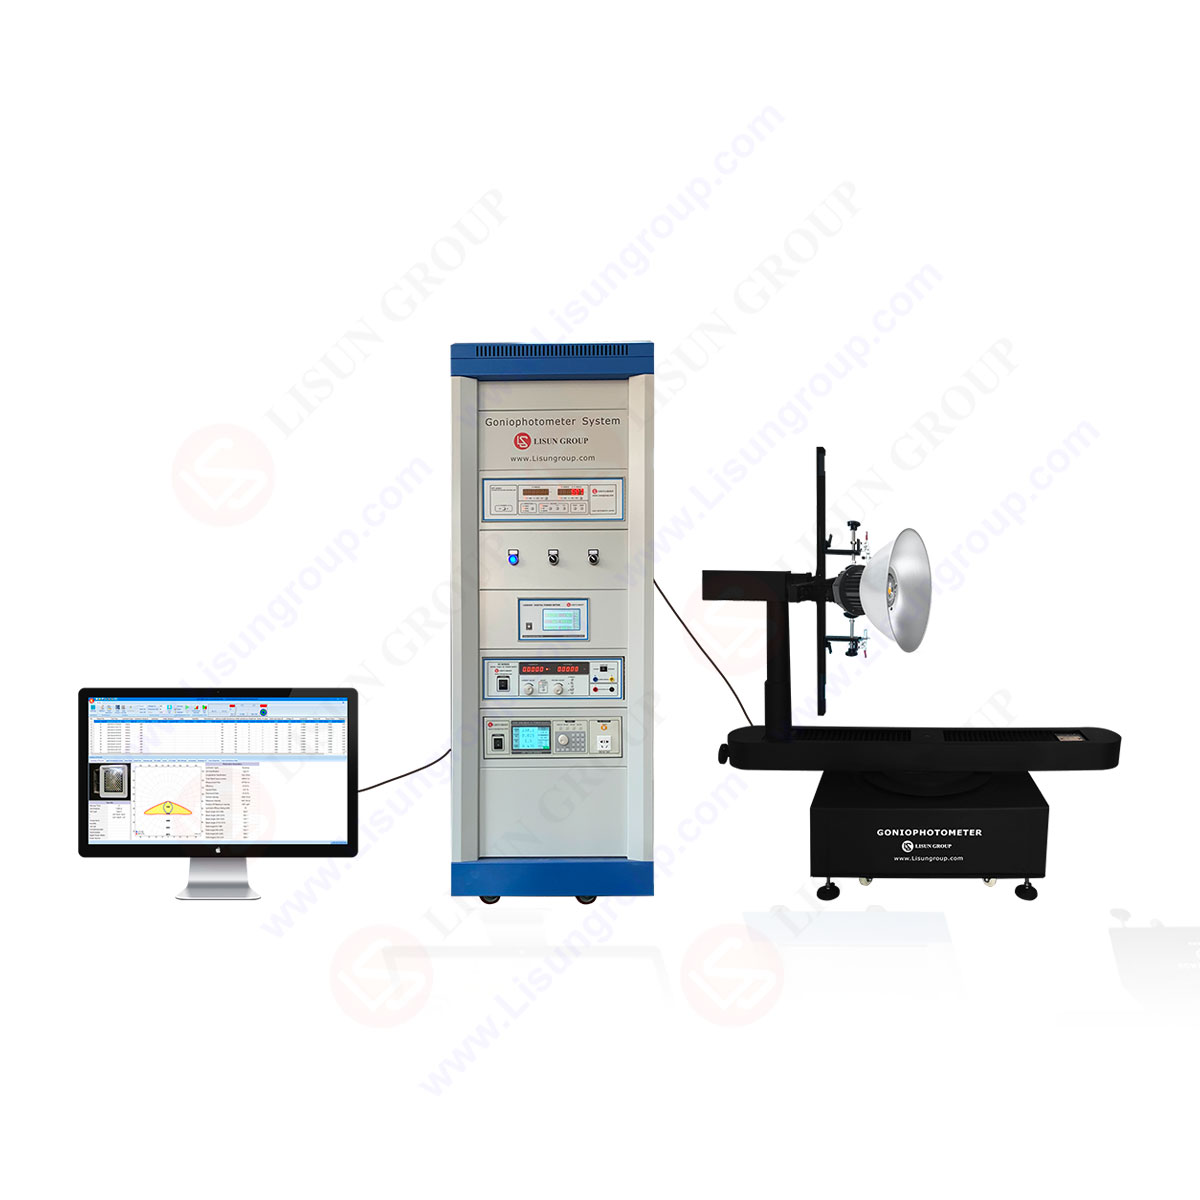
High Precision Rotation Luminaire Goniospectroradiometer
LSG-1890BCCD
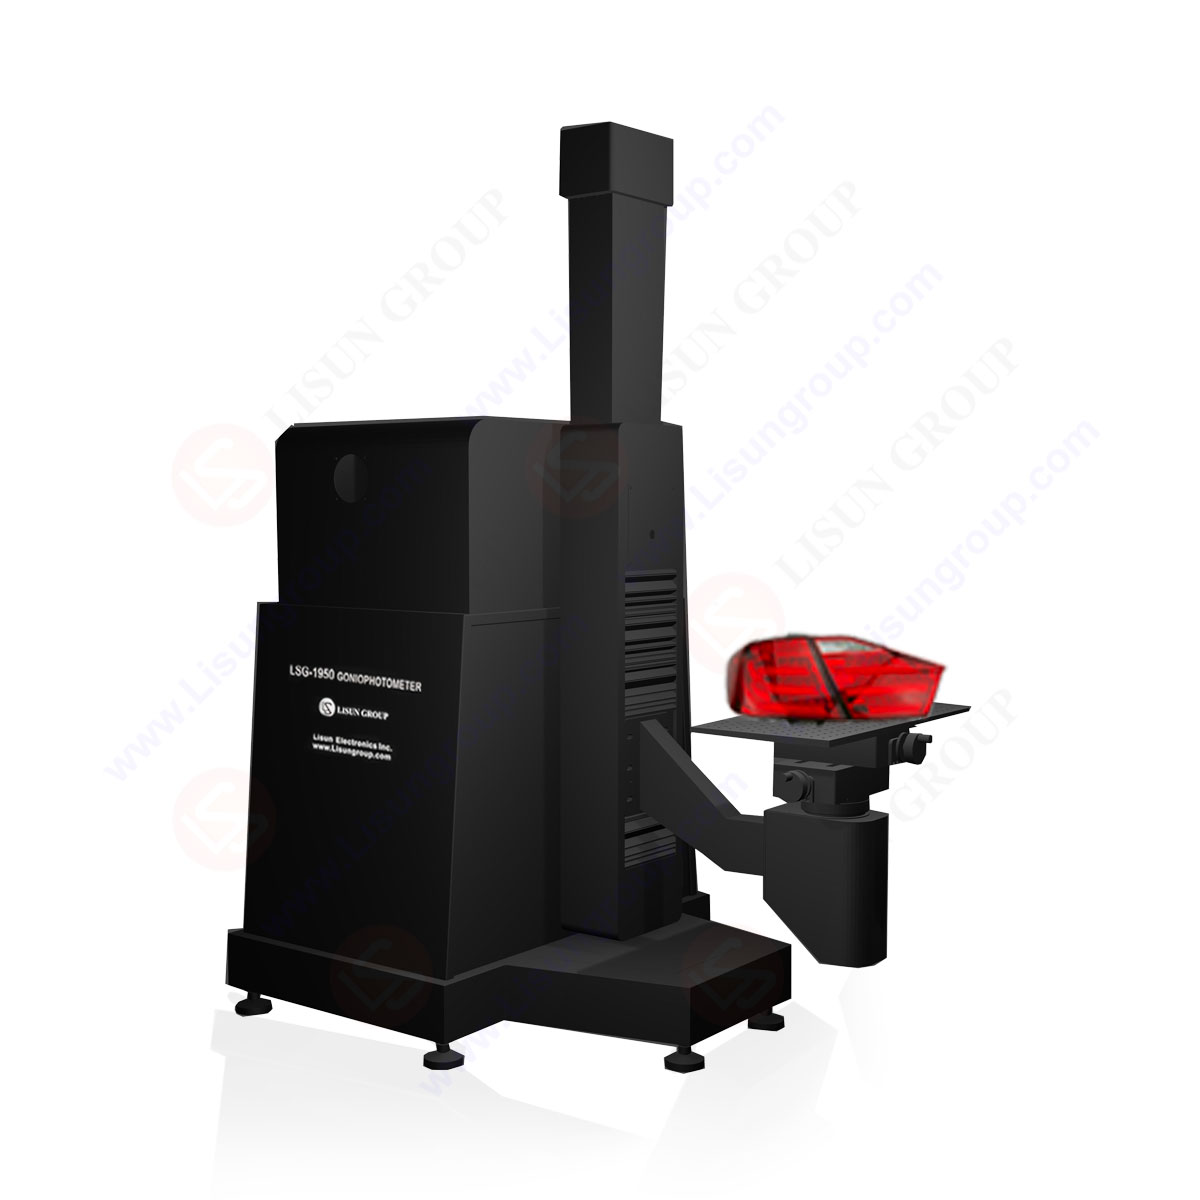
Goniophotometer for Automotive and Signal Lamps
LSG-1950
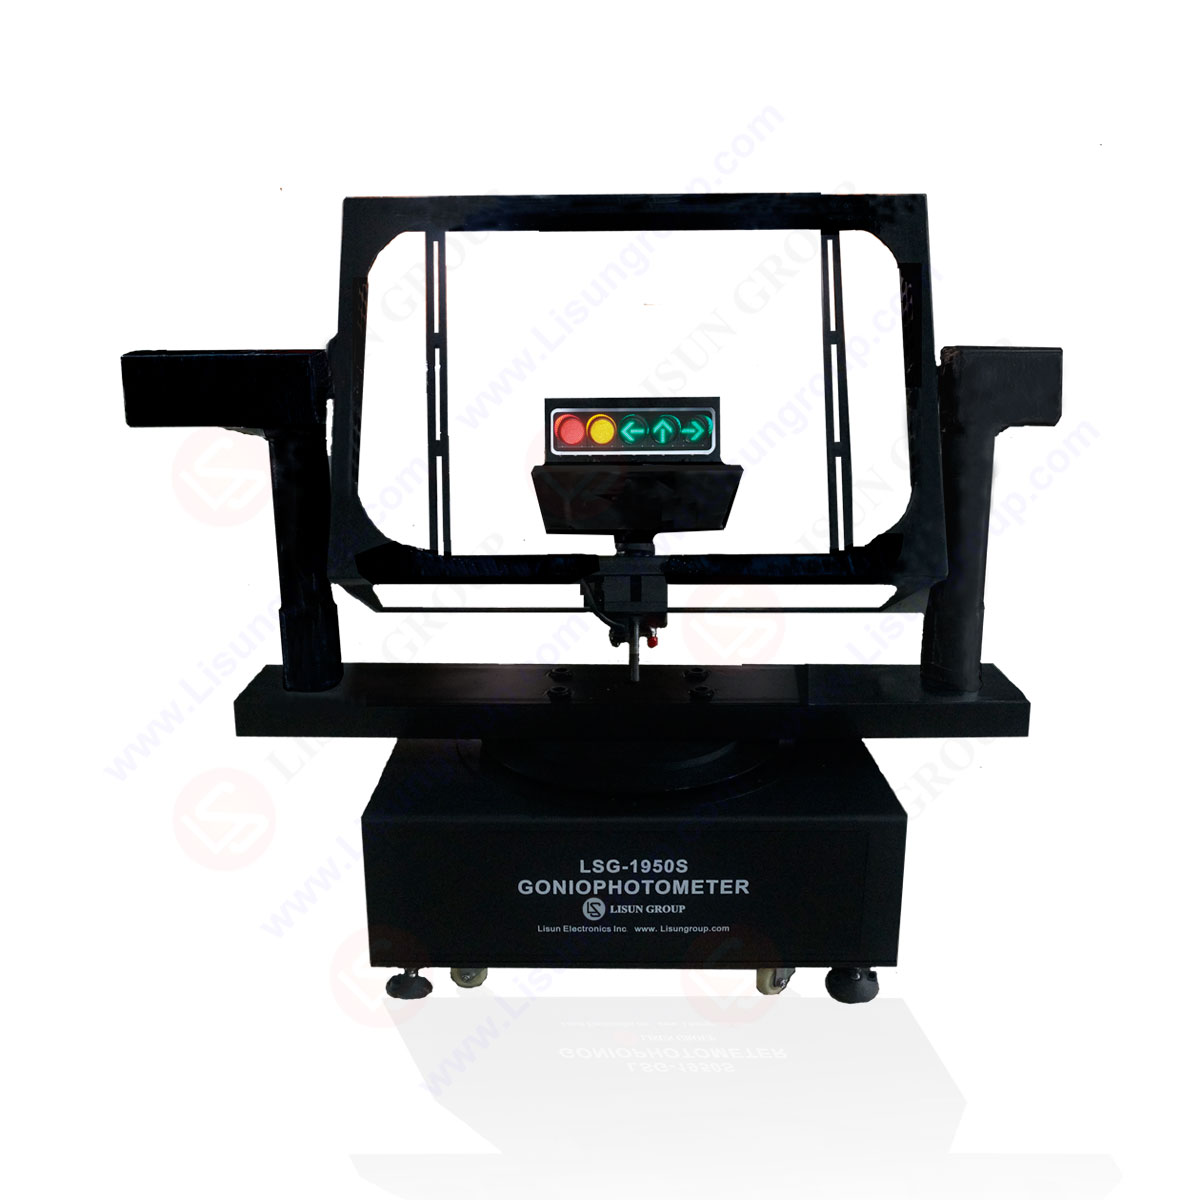
Goniophotometer for Traffic Signal Lamps
LSG-1950S
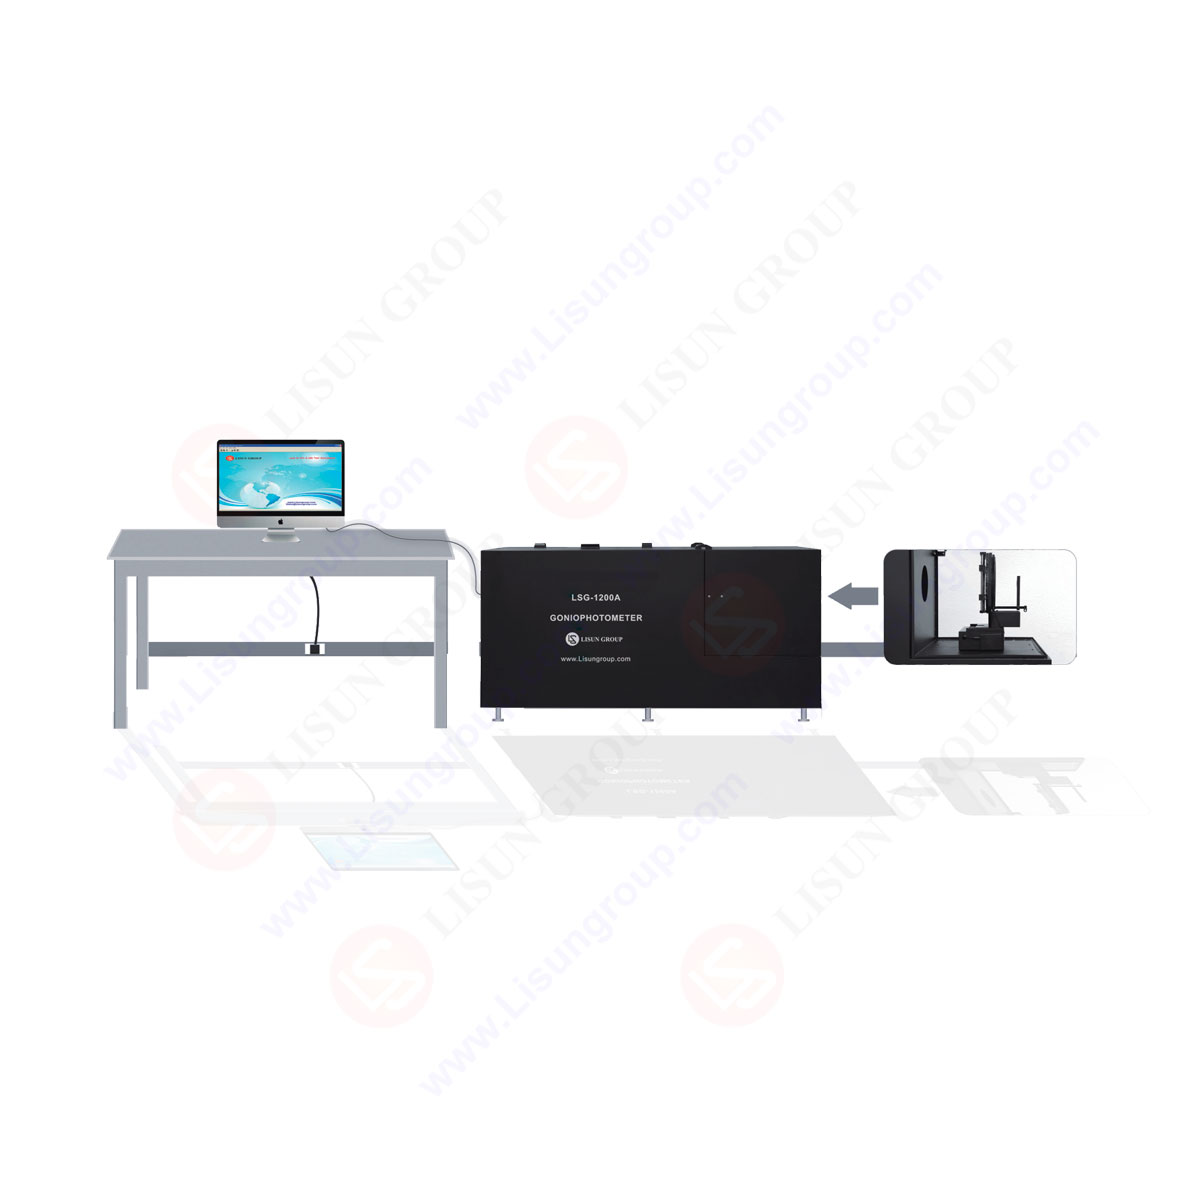
Compact Goniophotometer
LSG-1200A

Near Field Moving Detector Goniophotometer
LSG-1900B
Select an organization
to browse standards
Digital oscilloscopes make it much easier for engineers to gather and display electrical waveforms for analysis, which is a common task for the profession. It is crucial to correctly interpret and analyze waveforms to get a knowledge of the behavior of circuits, which is necessary for solving issues and improving efficiency.
This article will take you step-by-step through the process of reading and analyzing waveforms on a digital oscilloscope, beginning with the very basics, and working your way up to more advanced topics. Waveform capture, horizontal and vertical scaling, trigger design, waveform measurements, and techniques of in-depth analysis will all be topics of discussion during this part of the presentation.
By following these guidelines, engineers will have a better chance of consistently gleaning relevant information from waveforms that can be used in the design and testing processes.
When doing any kind of analysis or interpretation with the help of a digital oscilloscope, the first step is to acquire the waveform that you need. Position the oscilloscope’s probe so that it is looking at the part of the circuit that you wish to investigate.
Choose the proper voltage range and coupling (AC/DC), taking into consideration the characteristics of the signal that is being monitored. It’s possible that adjusting the attenuation of the probe and where it’s positioned can assist maintaining a constant and visible waveform display.
Beginning the process of recording waveforms on an oscilloscope may be initiated by using edge transitions and signal levels as triggers.
In order to correctly comprehend a waveform, one must first ensure that the vertical and horizontal scaling are proper. By altering the scale, you can make sure that the waveform takes up the majority of the vertical display on the oscilloscope without straying outside of the voltage range.
This guarantees that the sharpness and clarity are at their very best. Adjusting the horizontal time base such that it records a significant period of time will allow the essential aspects of the waveform to perhaps be seen more clearly.
Triggers are an essential component of waveform analysis, since they enable engineers to successfully stabilize and record recurring waveforms. Waveform analysis is a subfield of signal processing. The characteristics of the signal will be used to decide which kind of trigger, such as an edge trigger or a pulse trigger, is appropriate to use.
By altering the trigger level to a certain setting, the waveform may be caught at a specific position. You may either tune out the ambient noise by adjusting the sensitivity of the trigger, or zero in on the action you want to capture by concentrating on it. The trigger settings are what ensure the steadiness and constancy of the waveform display, which in turn makes it possible to conduct in-depth research.
Analyzing the quantitative information that is buried within waveforms is possible with the assistance of a number of measurement capabilities that are made available by digital oscilloscopes. Utilizing the cursors allows for more precise measurements of voltage, time, rise/fall, and pulse width to be taken.
Utilize the oscilloscope’s built-in measuring tools in order to quickly find values for a range of important metrics such as peak-to-peak voltage, average voltage, frequency, and duty cycle. These values may be determined by using the oscilloscope’s built-in measuring tools.
Utilizing these measures allows for the quantification of waveform properties, the verification of conformance with design criteria, and the identification of any irregularities that may be present.
With the assistance of digital oscilloscopes and the extensive analytical capabilities they provide, engineers may get further knowledge about waveforms. The FFT (Fast Fourier Transform) analysis is what makes frequency domain analysis feasible. Frequency domain analysis is what shows harmonic content and detects noise components within the waveform.
Utilizing spectrum analysis may help one have a better understanding of both the signal quality as well as issues that are connected to frequency. Persistence mode or waveform averaging are two methods that may be used to the analysis of data that is either intermittent or noisy in order to highlight more subtle alterations.
The use of mathematical operations on waveforms enables wider analyses to be carried out. By conducting mathematical operations on waveforms, such as addition, subtraction, multiplication, and division, engineers have the opportunity to gain insight into signal correlations or make computations for more study.
It is very necessary to annotate waveforms with the relevant information in order to conduct proper recording and analysis. Using a digital oscilloscope, engineers are able to annotate the waveform display with text and other annotations of their choosing.
This is helpful for establishing the context as well as noting certain characteristics of the measurements that were done on the waveform. LISUN has the best types of oscilloscopes.
You may store waveforms, pictures, or measurement data to a removable storage media on many digital oscilloscopes, allowing for subsequent examination, collaboration, or incorporation into a report or other written work. This feature is found on many digital oscilloscopes.
On a digital oscilloscope, engineers may superimpose many waveforms and compare them to one another in order to investigate the relationships between the signals. When examining difficulties with signal interconnections, time linkages, or the general behavior of the system, this capability is very beneficial.
When two waveforms are superimposed on top of one another, technicians are easily able to identify faults, assess signal quality, or follow changes over time. This kind of research is helpful in a number of ways, including enhancing one’s ability to understand how a circuit works, detecting anomalies, and fine-tuning the operation of a system.
When viewing waveforms on a digital oscilloscope, one of the most important skills to have is the ability to recognize and eliminate signal anomalies as well as noise. Inadequate grounding, electromagnetic interference (EMI), or inadequate shielding might be the root cause of any noise or distortions seen in the waveforms that were acquired.
By carefully scrutinizing the waveforms, engineers are able to differentiate between true signal components and noise artifacts. A number of techniques, including as signal averaging, noise filtering, and adjusting the parameters of the probe, may be used to reduce the amount of background noise and improve signal clarity.
Reading and analyzing waveforms on a digital oscilloscope is a skill that is necessary for engineers working in a wide variety of fields. By using a methodical approach to waveform capture, scaling, and triggering, as well as by making use of measurement and analysis tools, engineers may be able to gather helpful insights into the behavior of circuits, detect defects, and improve performance.
The availability of advanced analytical techniques and features in digital oscilloscopes, such as FFT analysis, waveform math, and waveform comparison, significantly expands the possibilities of these instruments.
Validating design standards and assuring the dependability and performance of electronic systems necessitates the capacity of engineers to accurately grasp and analyze waveforms. This is also essential for preventing errors in the design process.
Tags:OSP-1102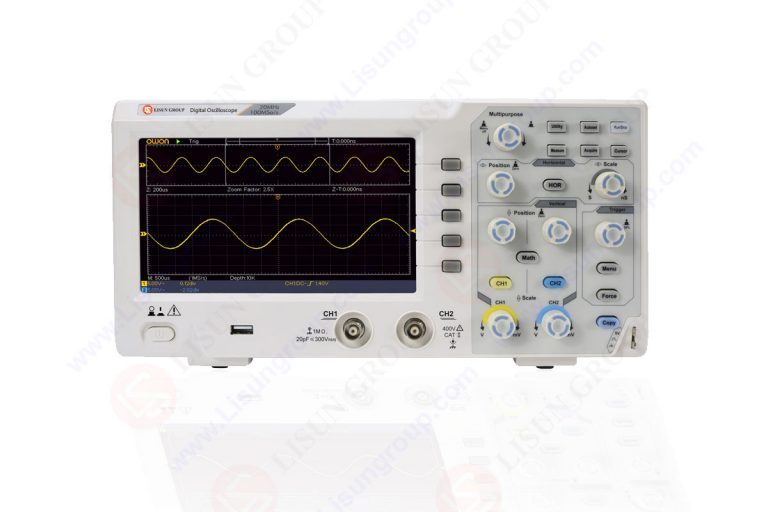

 中文简体
中文简体