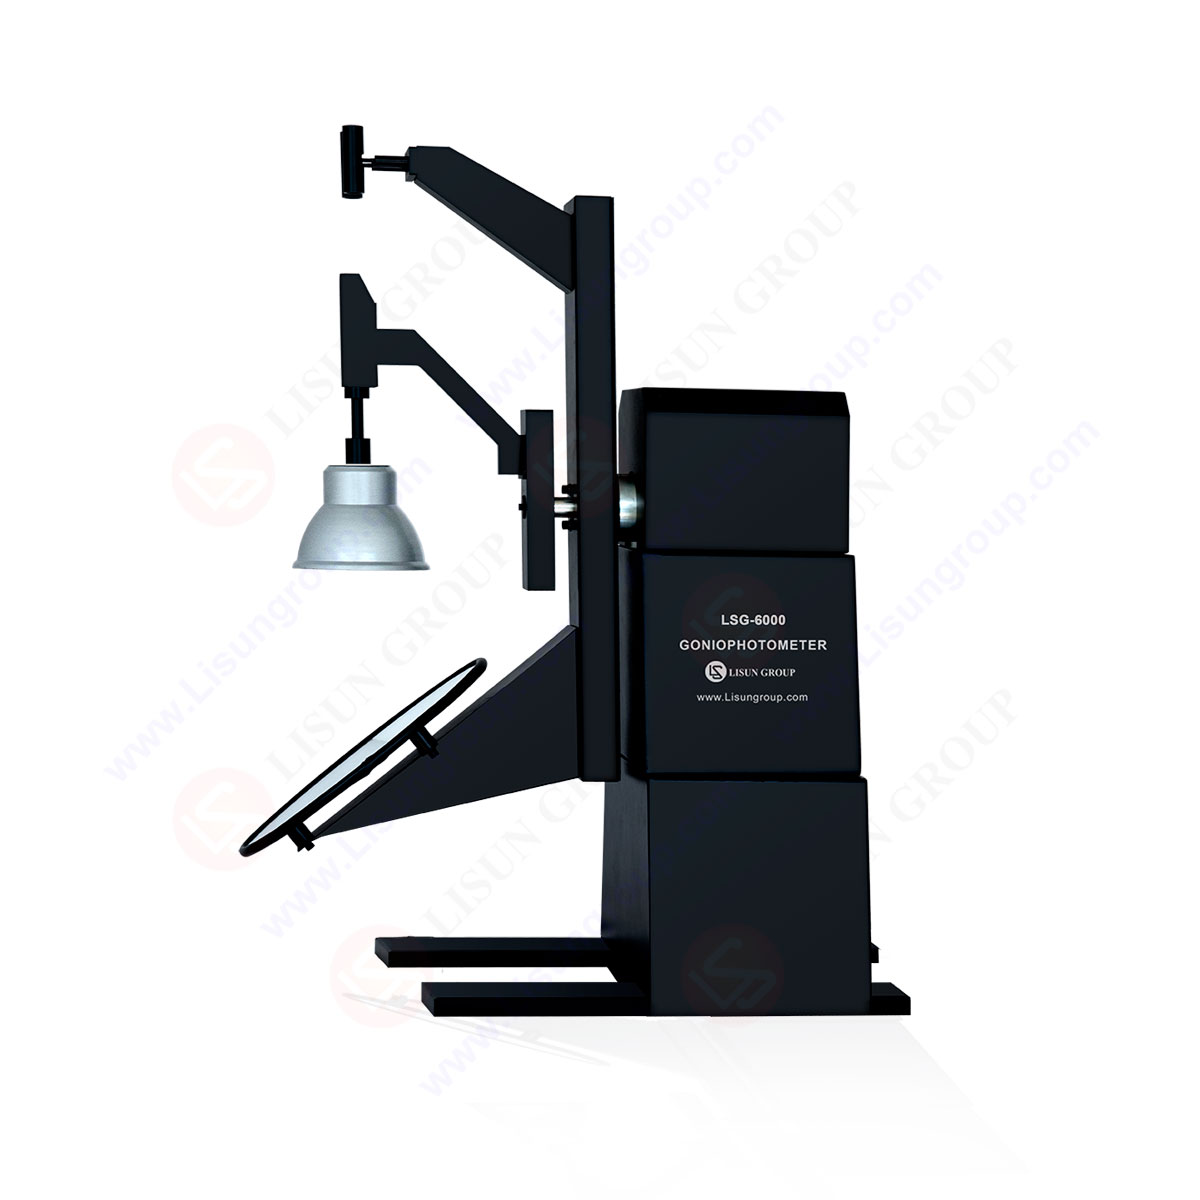
LM-79 Moving Detector Goniophotometer (Mirror Type C)
LSG-6000
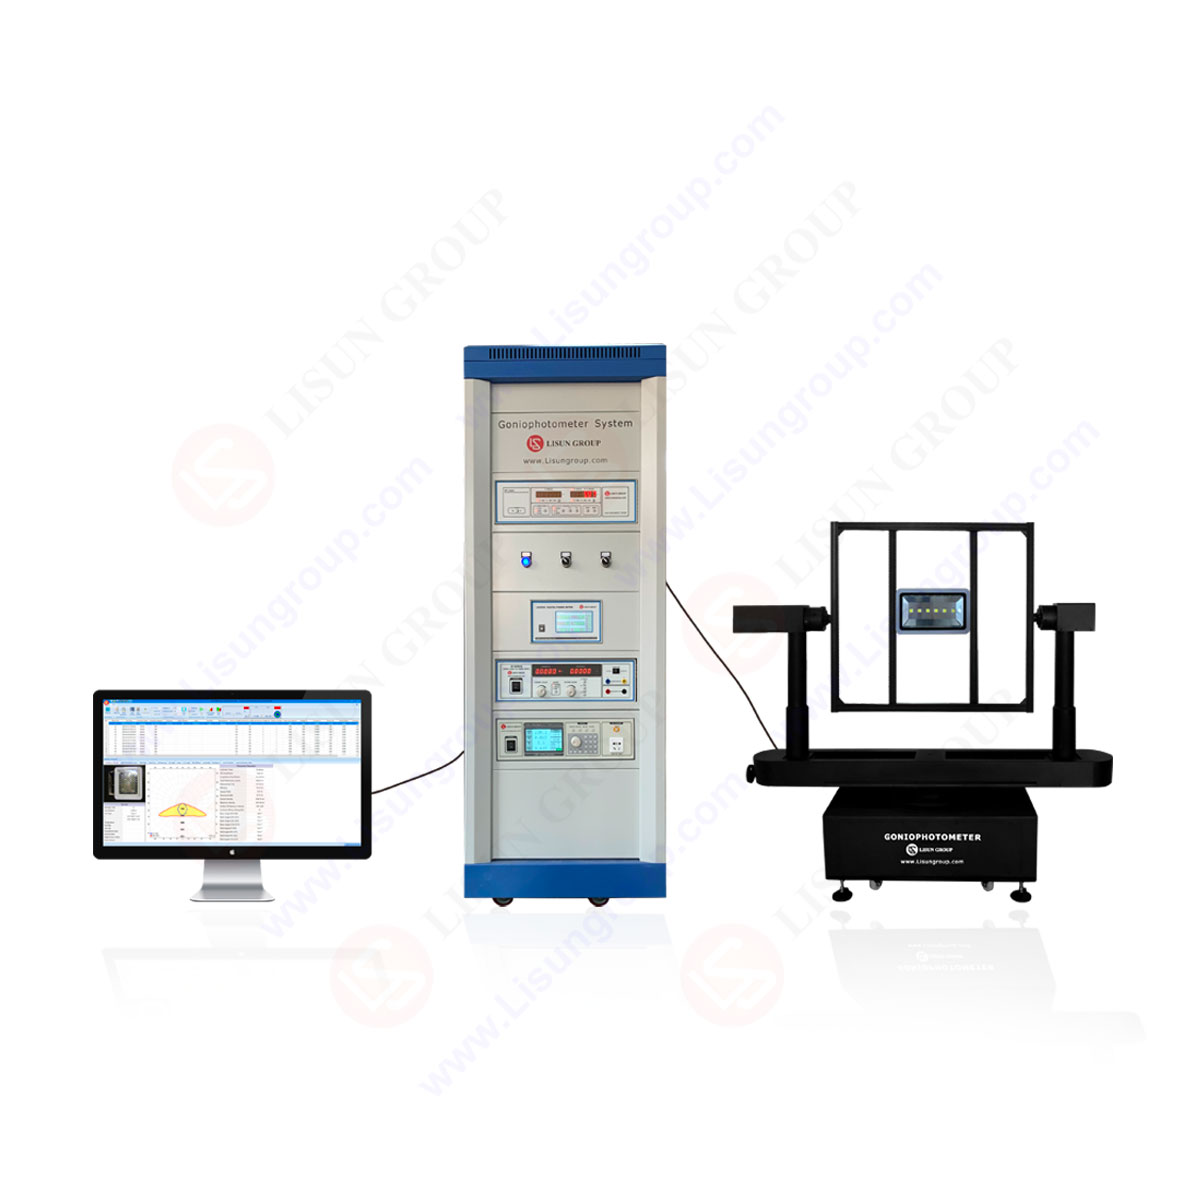
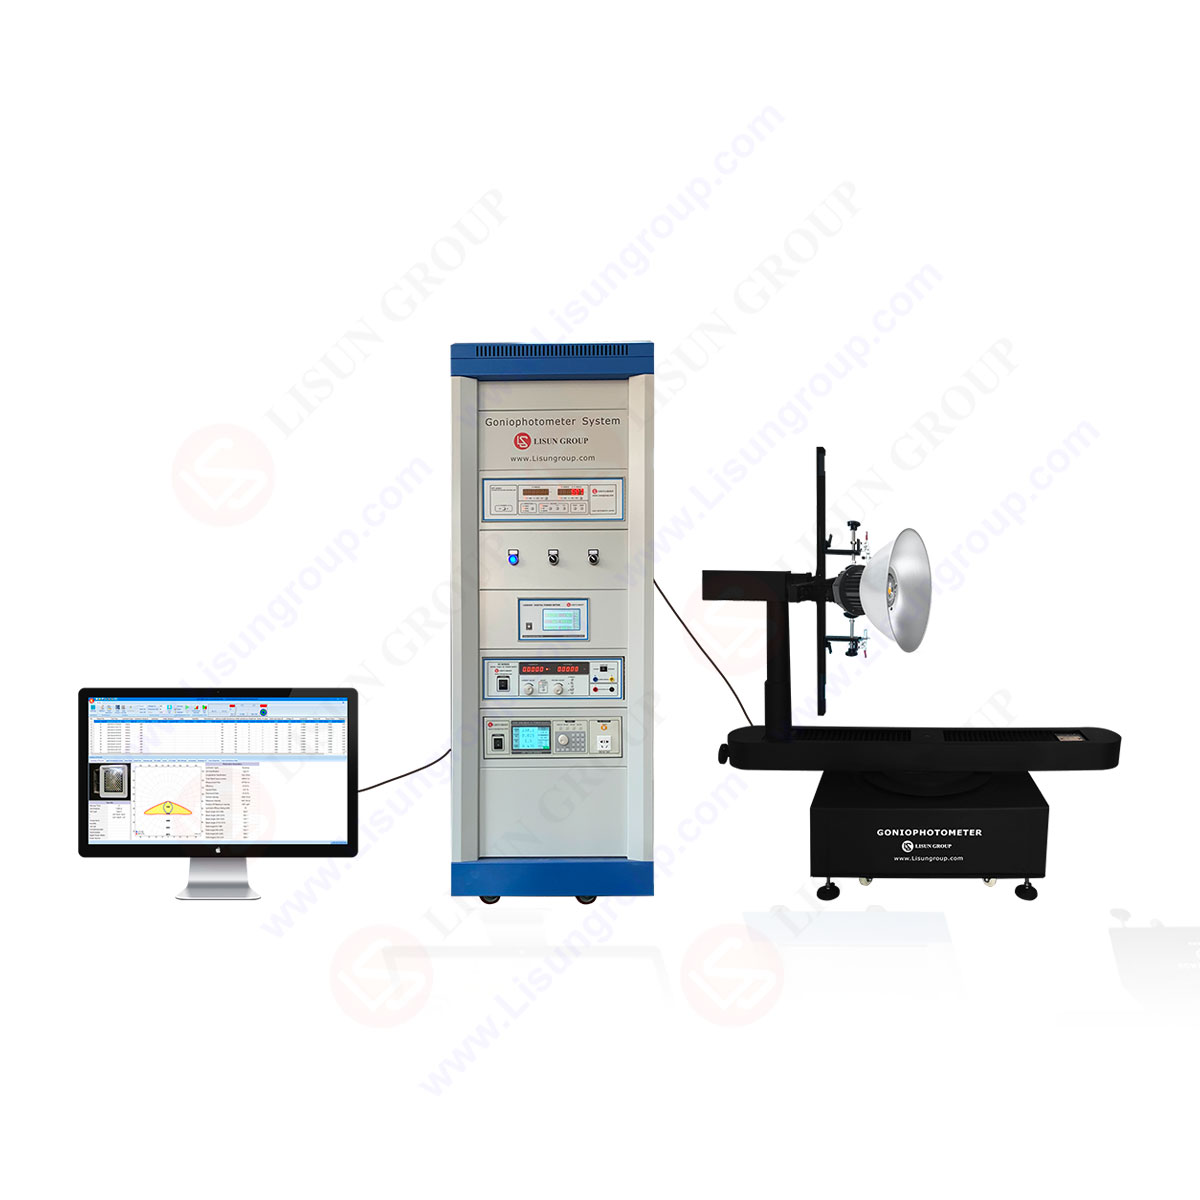
High Precision Rotation Luminaire Goniophotometer
LSG-1890B
High Precision Rotation Luminaire Goniospectroradiometer
LSG-1890BCCD
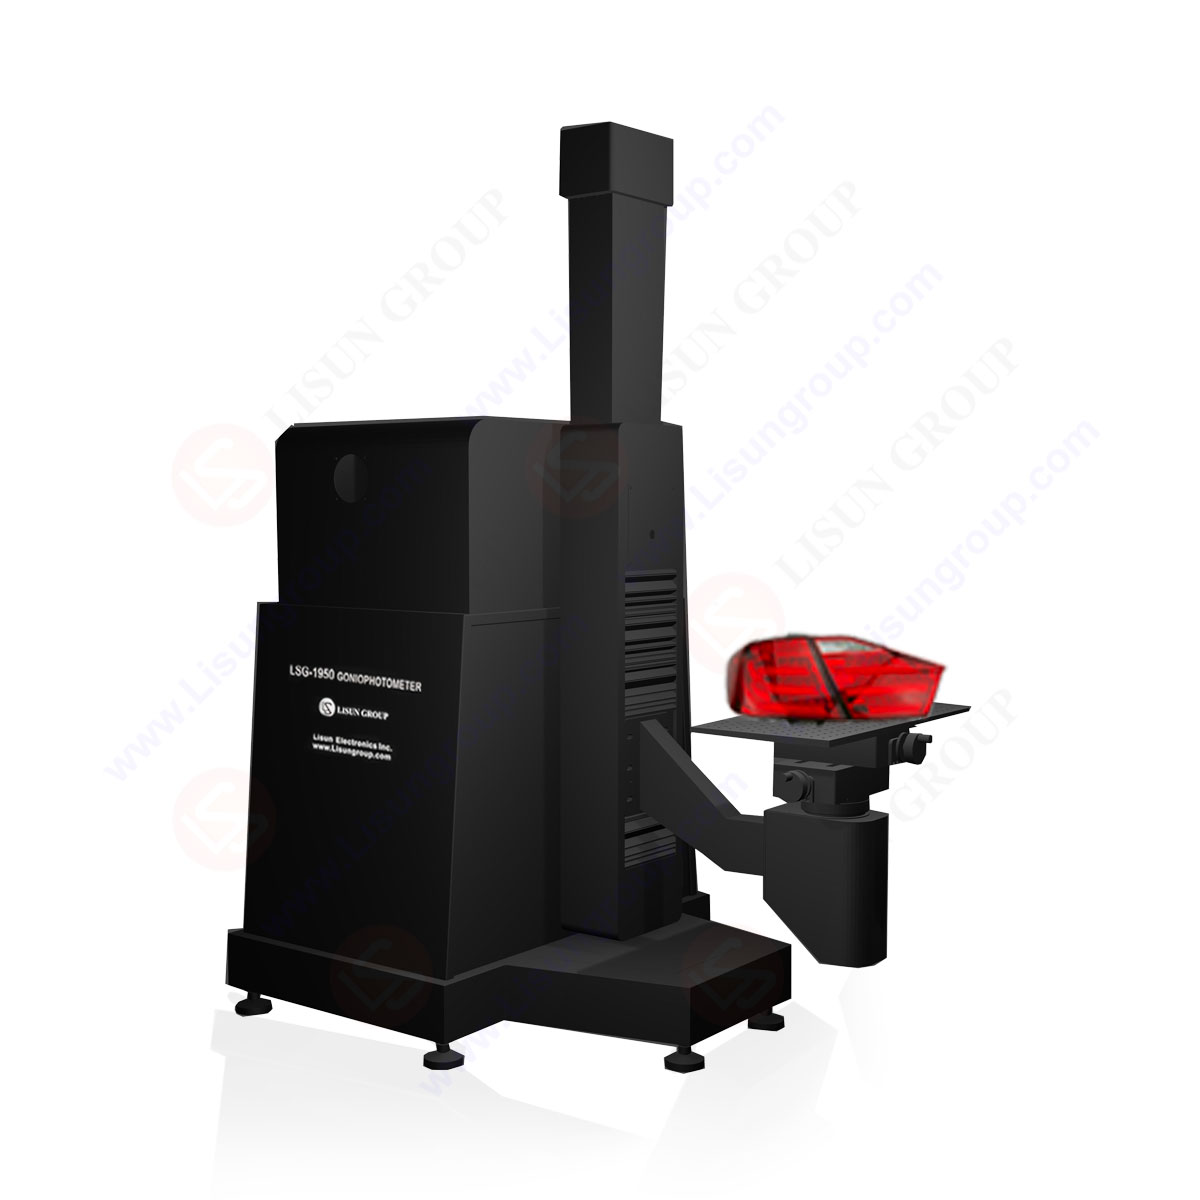
Goniophotometer for Automotive and Signal Lamps
LSG-1950
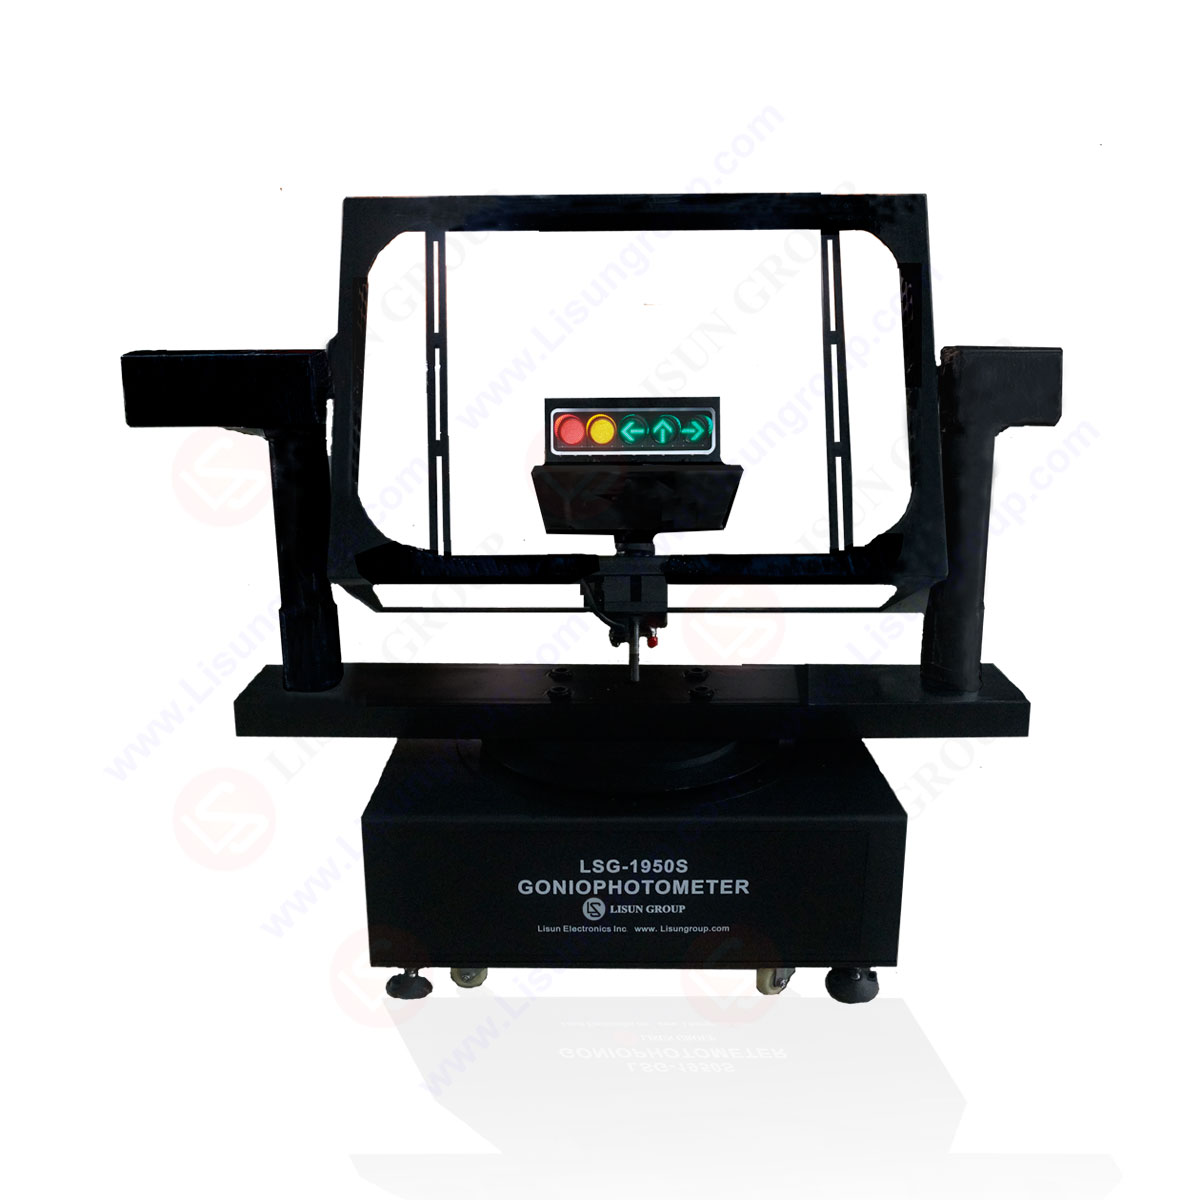
Goniophotometer for Traffic Signal Lamps
LSG-1950S
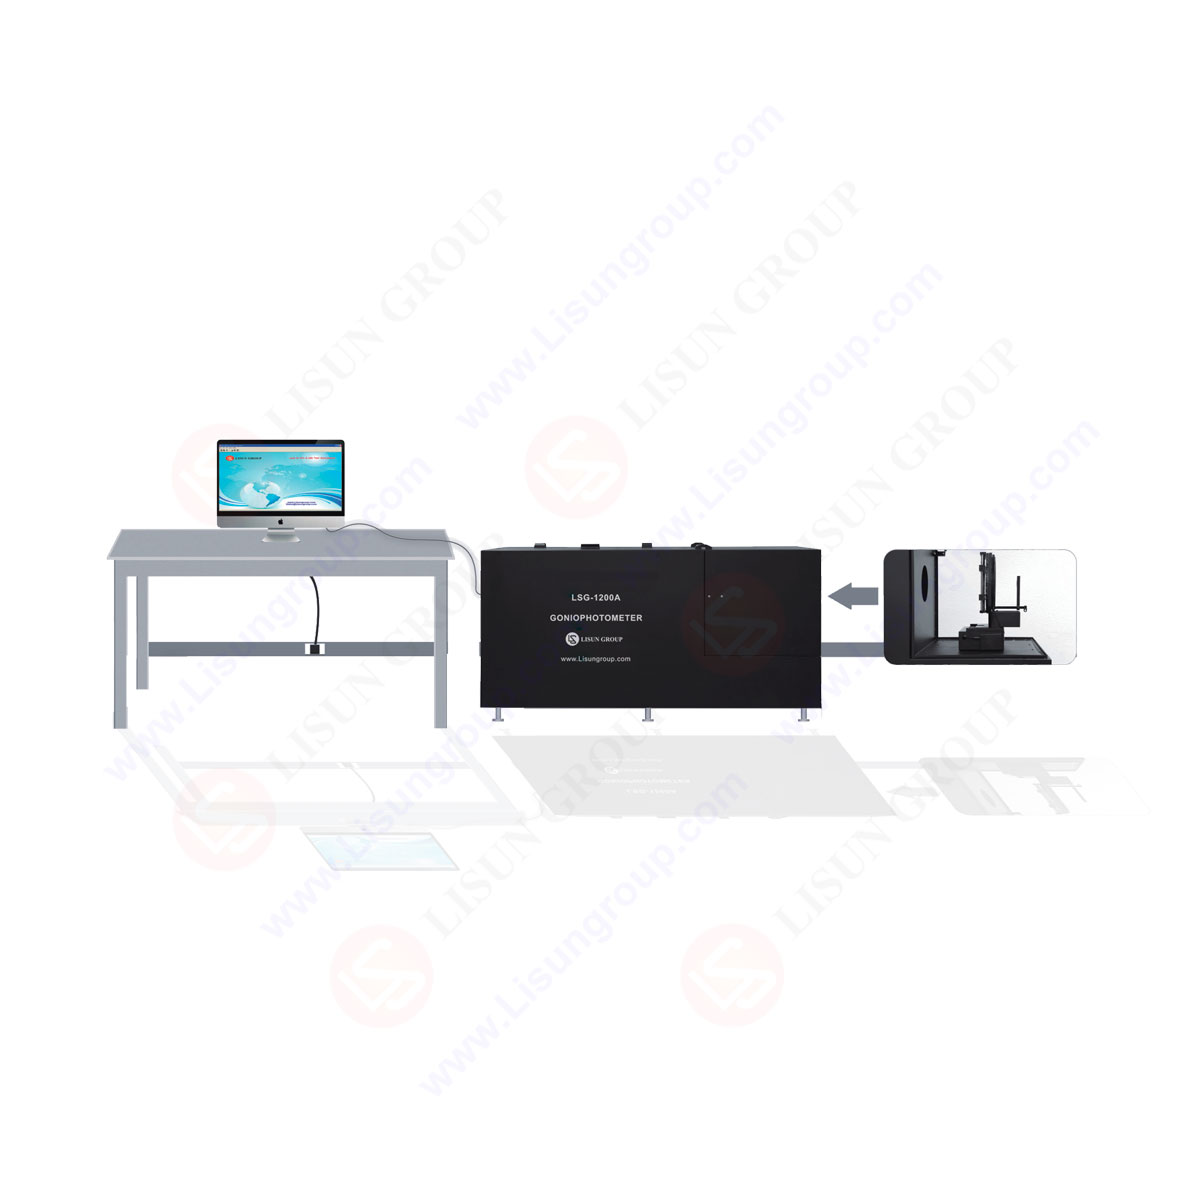
Compact Goniophotometer
LSG-1200A

Near Field Moving Detector Goniophotometer
LSG-1900B
Select an organization
to browse standards
We know that there is a corresponding system for each instrument, and the colorimeter is no exception. The color measurement system of the colorimeter is also called the color system or color system, which is actually the way people organize and represent colors. In general Chinese literature, “color system” is used to be called color system. So far, there are two main methods for color representation of colorimeter, one is “color model”, and the other is “cataloging system”.
The color model is a set of rules and definitions that describe all colors in a simple way in the development and use of colorimeter. Among them, color space is the most common example of color model. CIE LAB, CIE XYZ, RGB and CMYK are color models. The cataloging system assigns a unique name or number to each color. Such as Munsell color system, Pantone color card, etc. According to the Lab and Lch principles of CIE color space, it can measure and display the color difference △ E and △ Lab values between the sample and the tested sample, distinguish the subtle differences between colors, and achieve the degree of color coincidence.
However, the use of Munsell color system is higher in the color-difference instrument industry. Munsell system divides the three-dimensional color space into three axes: hue, brightness and chroma. This system is very powerful in order, but it does not provide the coordinate system required for color space description of colorimeter. Based on this disadvantage, colorists have developed a CIE color system that converts any spectral curve into three letters and becomes the tricolor value X, Y, Z. When Y is associated with light, X and Z are independent of hue and chroma.
Colorimeter CIE 1976 LAB chromaticity space
CIE1976LAB color space is usually called CIE LAB in the colorimeter industry. It is also called CIE L * a * b * in many colorimetric literature. CIE LAB is the current international color measurement standard and the most widely used chromaticity space in the color industry. This color space uses coordinates to mark chroma values, which is called chromatic coordinates. The idea of using color coordinates comes from the fact that colors are not both red and green or both blue and yellow, but colors can be considered as combinations of red and yellow, red and blue, green and blue.
In fact, we have many schemes for the analysis of colorimeter, and the 3D map and contour map are shown in Figure 1-3 below. In this group of pictures, the number marked on the chromaticity C axis is the corresponding Munsell chromaticity; We select 1 to 20 color phases on the color phase H axis, and the 20 color phases are 5R, 10R, 5YR, 10YR, 5Y, 10Y, 5GY, 10GY, 5G, 10G, 5BG, 10BG, 5B, 10B, 5PB, 10PB, 5P, 10P, 5RP, 10RP; Color difference of colorimeter Δ E ab is the average value of the color difference between each color sample and the surrounding adjacent points. On the contour map, the data marked on each contour is the color difference value of each contour Δ E
ab。
If the color difference between two adjacent points should be equal under an ideal uniform environment, but we can see from the figure that the color difference measured by the colorimeter is not equal. With the increase of chromaticity, the color difference value also increases correspondingly, and the degree of color difference increase in each color phase is also different with the increase of chromaticity.
Through comprehensive analysis of these three-dimensional color maps, the color difference increases significantly near the color phase lines of 7, 8, and 9, namely, H=5GY, H=10GY, and H=5G, especially in the high brightness area. On the contour map, the contour value also increases with the increase of chromaticity, indicating that the color difference value increases with the increase of chromaticity; However, the number of contour lines in the medium-low lightness map is relatively small and the line spacing is relatively large, which indicates that the degree of color difference increase with chromaticity in the low lightness map is smaller than that in the high lightness map. In the high brightness contour map, the color difference contour line is almost perpendicular to the color phase axis and closely distributed near the color phases 8, 9 and 10, which indicates that the color difference has a large response to the color phase and the color width capacity of the color phase is large.
Fig. 1 3D map and contour map (V=2)


3D Map And Contour Map (V=2)
Fig. 2 3D map and contour map (V=5)


3D Map And Contour Map (V=5)
Fig. 3 3D map and contour map (V=8)


3D map and contour map (V=8)
According to CIE standard colorimetric system of color difference instrument, it is the basis of quantitative description of color. On the contour map, the contour value also increases with the increase of chromaticity, indicating that the color difference value increases with the increase of chromaticity; However, the number of contour lines in the medium-low lightness map is relatively small and the line spacing is relatively large, which indicates that the degree of color difference increase with chromaticity in the low lightness map is smaller than that in the high lightness map. In the high brightness contour map, the color difference contour line is almost perpendicular to the color phase axis and closely distributed near the color phases 8, 9 and 10, which indicates that the color difference has a large response to the color phase and the color width capacity of the color phase is large.
Metal: used for measuring the color of metal surface treatment and metal electroplating.
For example, color measurement of copper-nickel-chromium layer on steel, silver-inum layer on steel, and color detection of iron cabinet
Textiles: textile colorimeter, fabric colorimeter, textile colorimeter, leather colorimeter
Paint: paint color difference meter, spray color difference meter, coating color difference meter, powder color difference meter
Furniture: furniture colorimeter, paint colorimeter, paint colorimeter
Automobile: automobile color difference instrument, automobile paint color difference instrument
Food: tomato paste colorimeter meat colorimeter tobacco colorimeter
Ink: ink colorimeter, paper colorimeter, printing colorimeter
Plastic: plastic colorimeter, plastic colorimeter
Portable Colorimeter/Chroma Meter is an innovation color measuring tool with powerful configuration to make color measurement easier and more professional; It support Bluetooth to connect with Android and ISO devices, Portable Colorimeter/Chroma Meter will take you into a new world of color management; It can be widely used to measure color value, color difference value and find similar color from color cards for printing industry, paint industry, textile industry, etc.

CD-320PRO_Portable Colorimeter/Chroma Meter
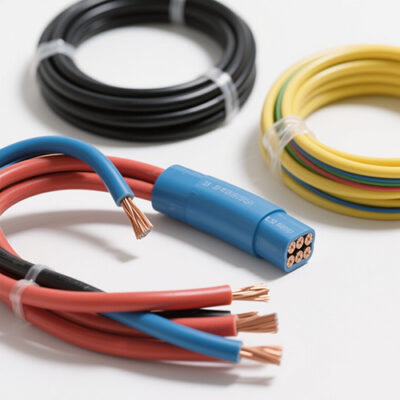
LISUN’s cable and wire test solutions meet IEC 60245-1, IEC 60227-1, IEC 60502-1 and IEC 60189 standards, covering electrical, mechanical, and safety tests for global compliance.
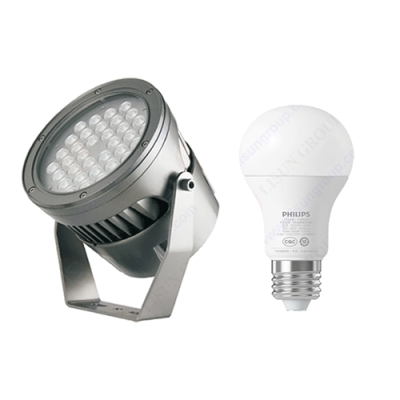
LISUN’s indoor and outdoor LED test solutions meet IEC 60598-1, IEC 62722-2-1, CIE 121 standards, covering safety, photometry, and environmental tests for global compliance.

 中文简体
中文简体