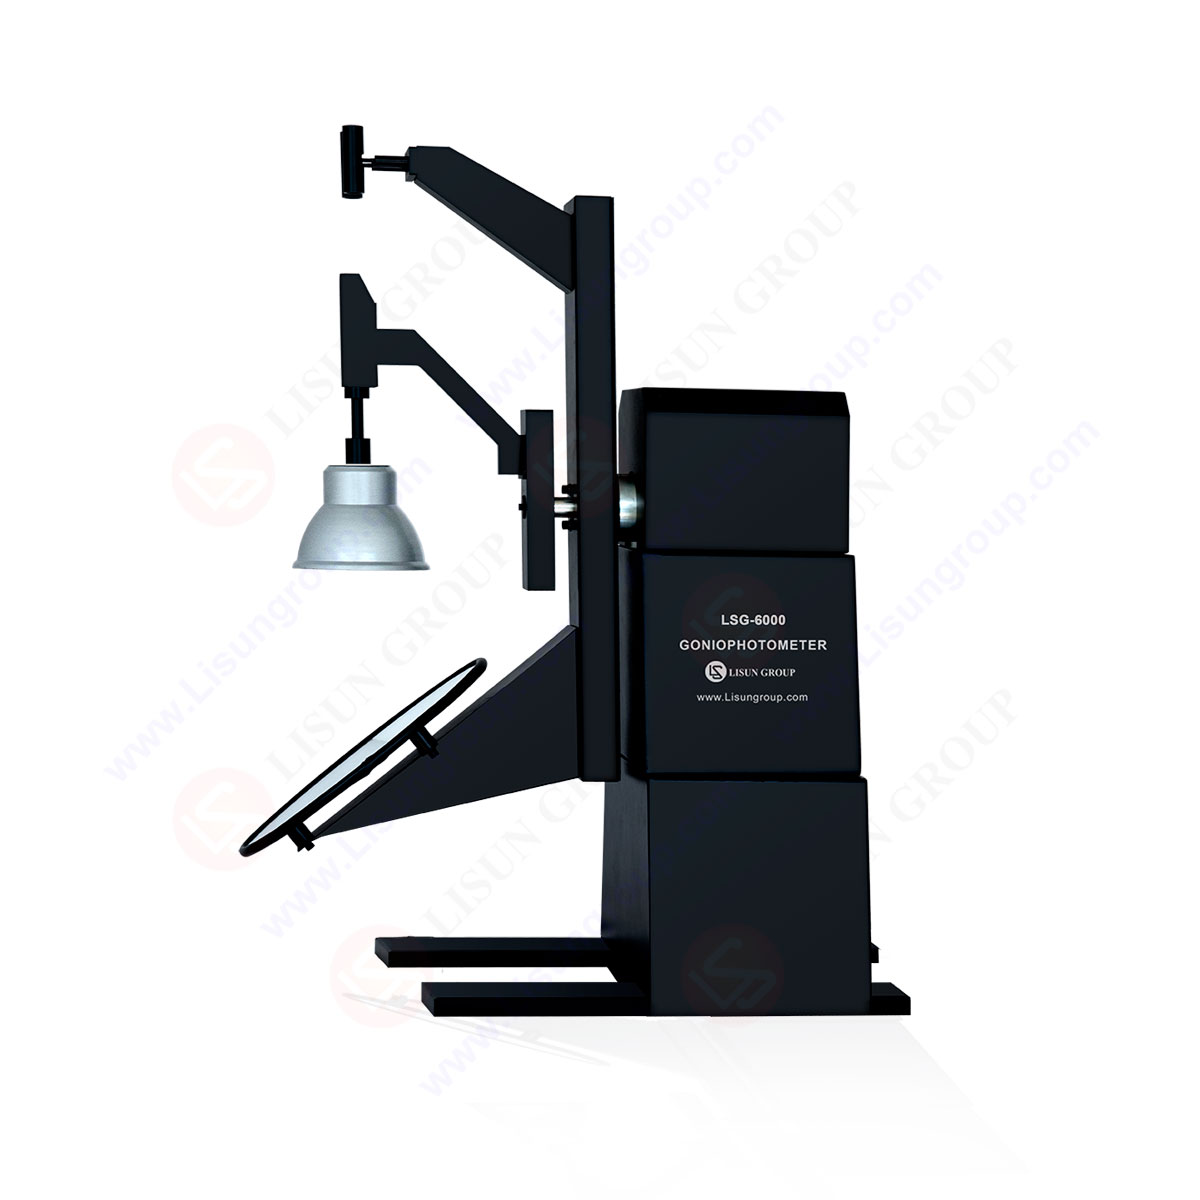
LM-79 Moving Detector Goniophotometer (Mirror Type C)
LSG-6000
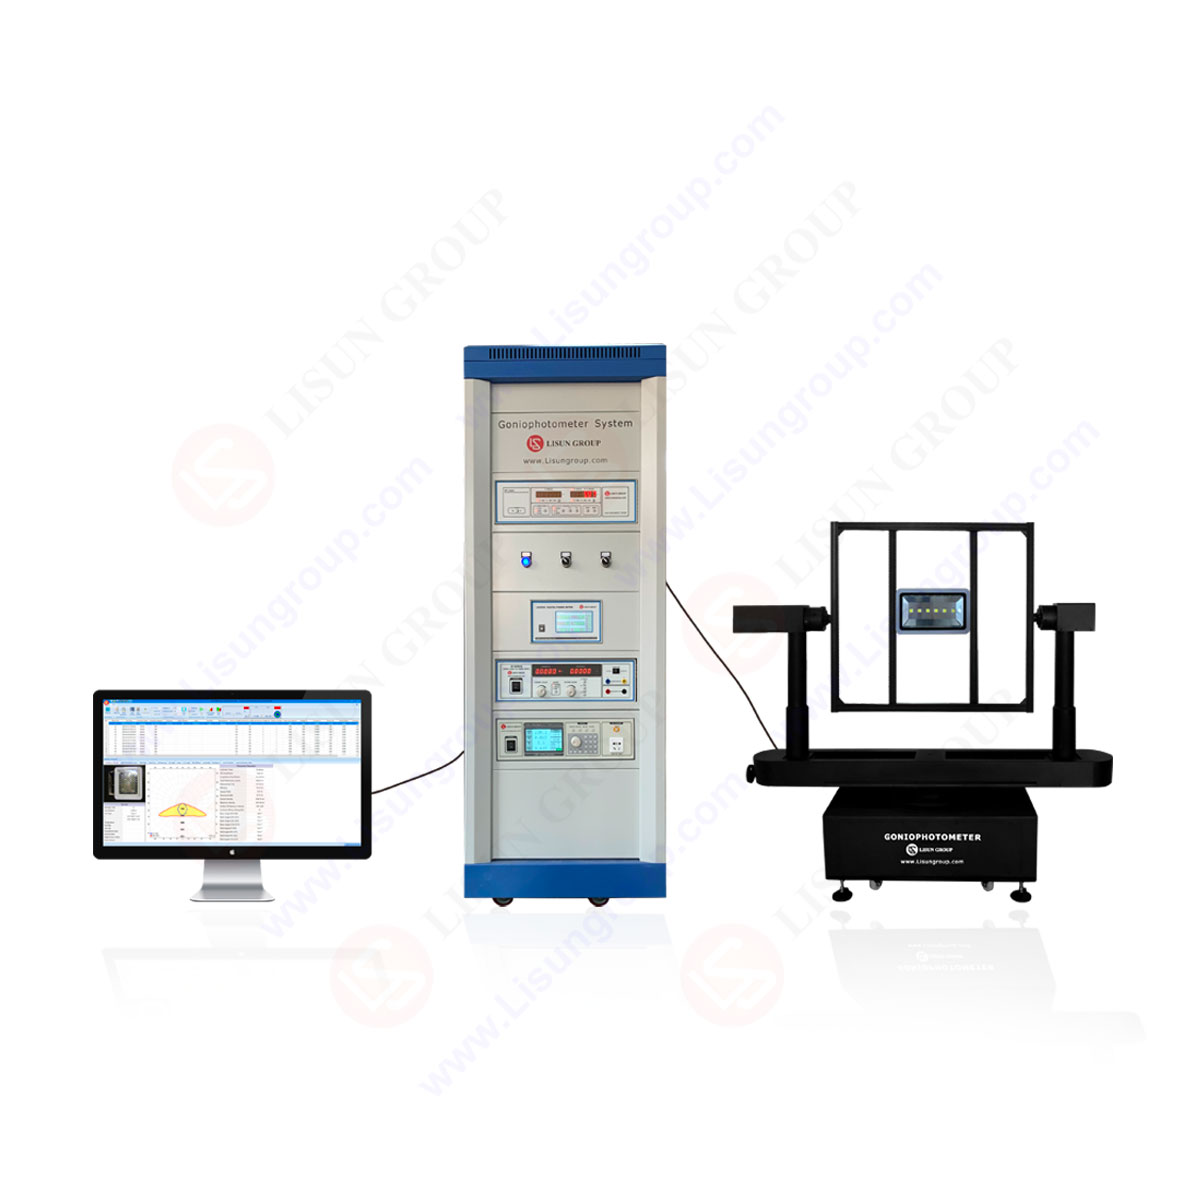
High Precision Rotation Luminaire Goniophotometer
LSG-1890B
High Precision Rotation Luminaire Goniospectroradiometer
LSG-1890BCCD
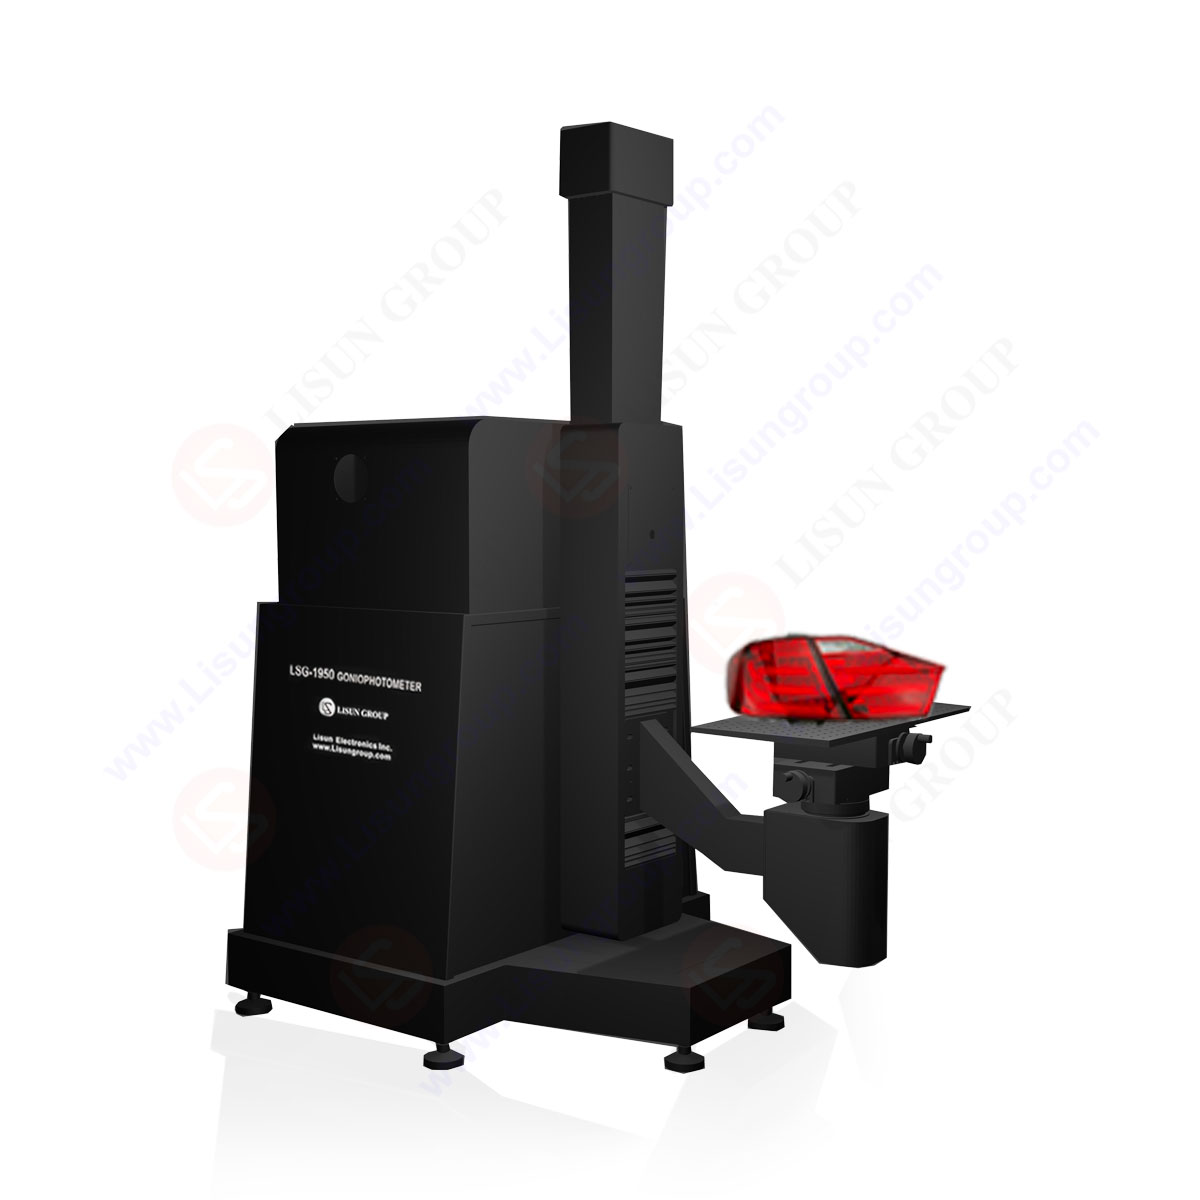
Goniophotometer for Automotive and Signal Lamps
LSG-1950
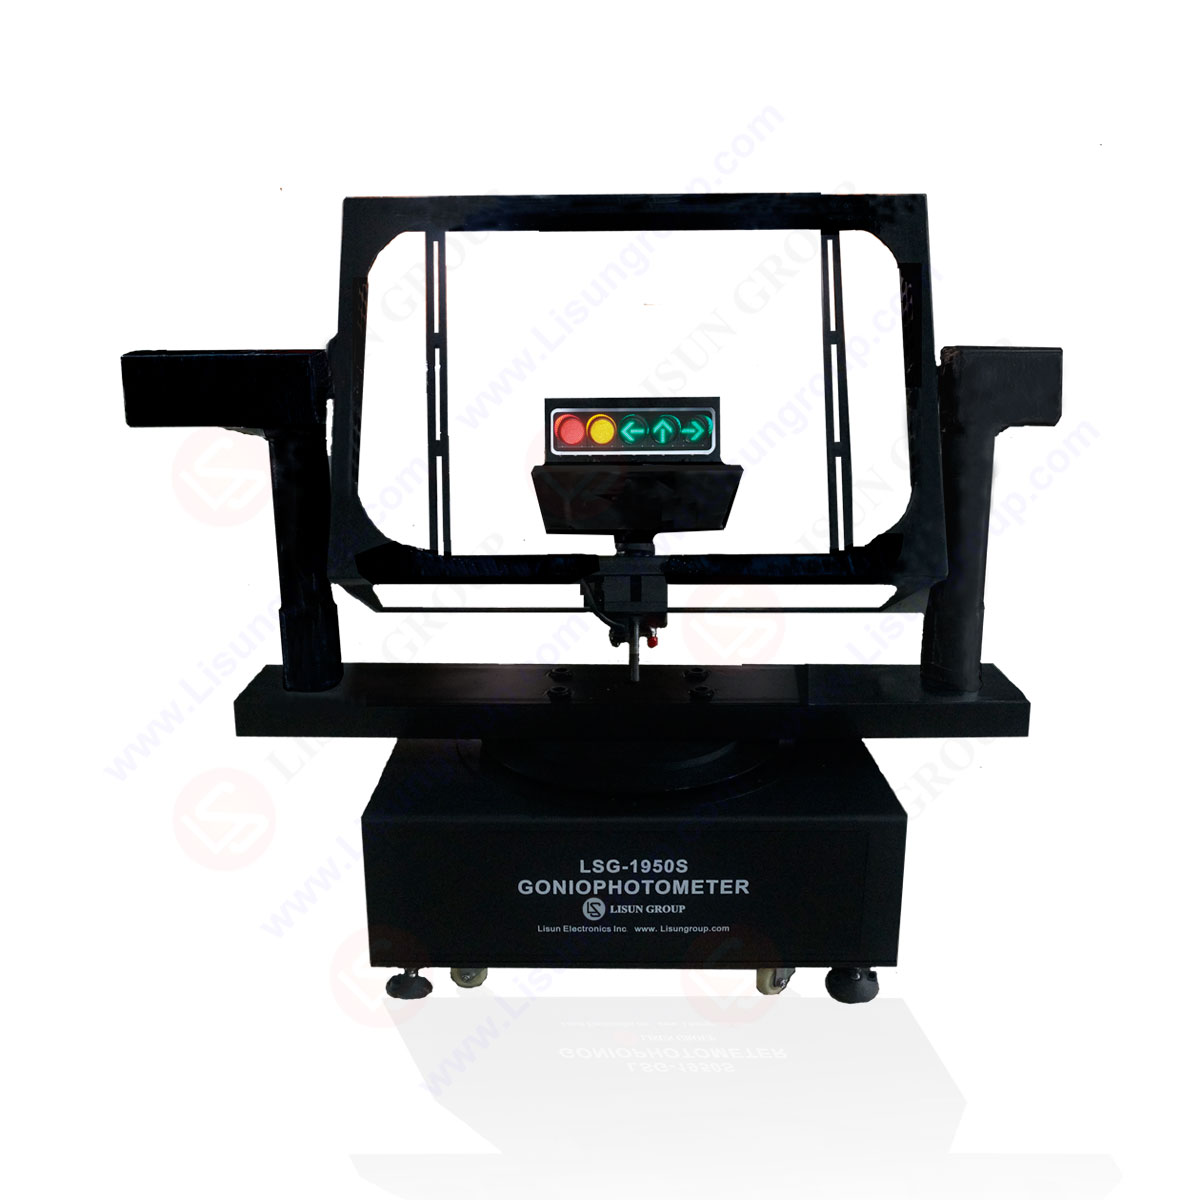
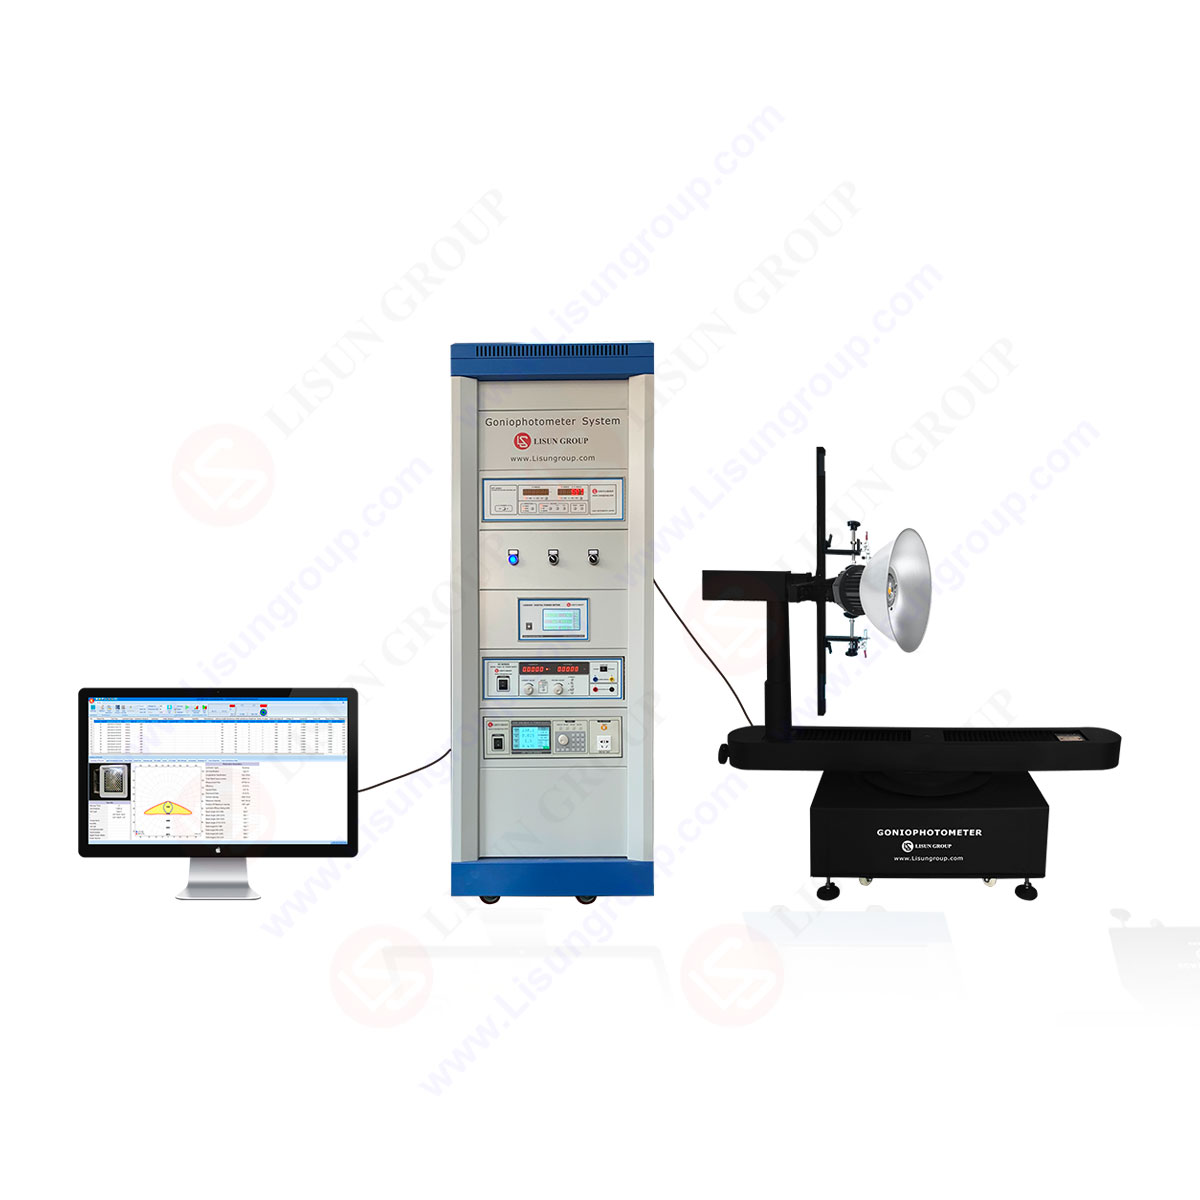
Goniophotometer for Traffic Signal Lamps
LSG-1950S
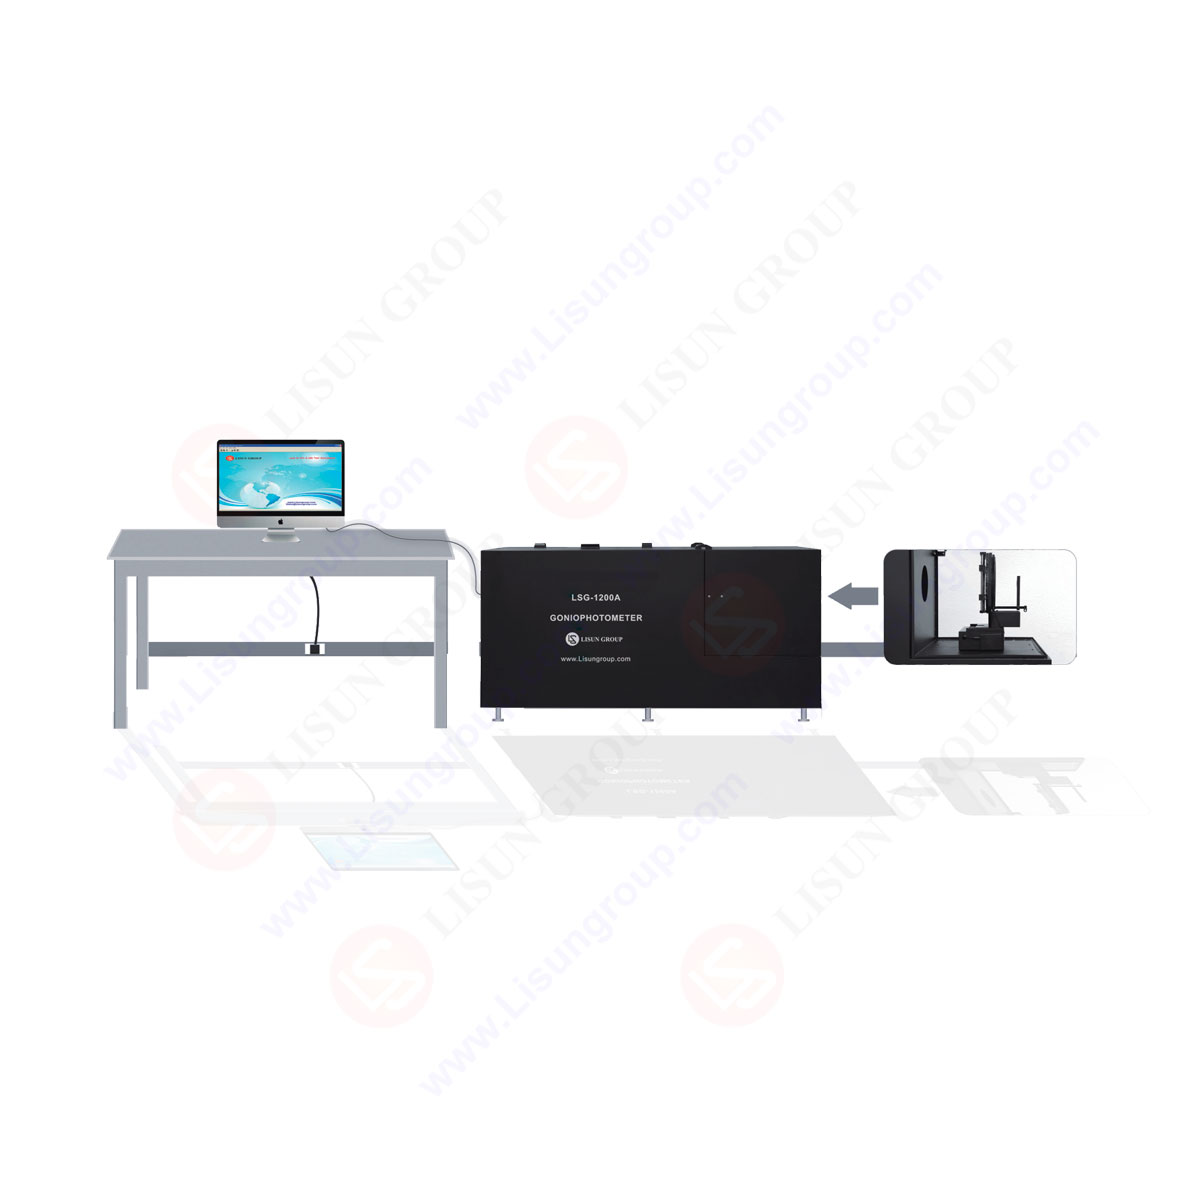
Compact Goniophotometer
LSG-1200A

Near Field Moving Detector Goniophotometer
LSG-1900B
Select an organization
to browse standards

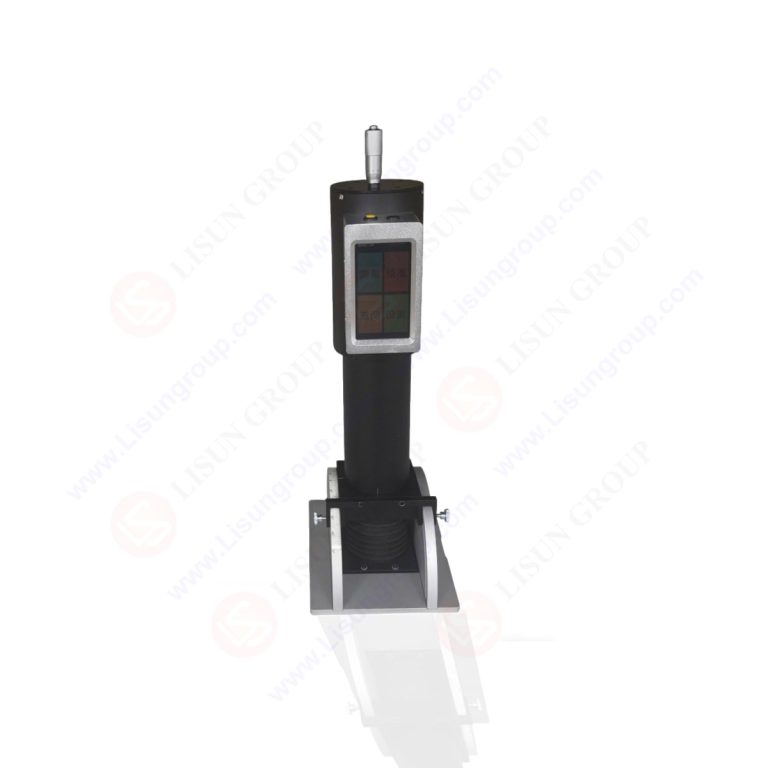
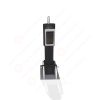
Product No: LS-101C
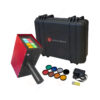
The LS-101A/LS-101C Pavement Marking Retroreflectometer | Marking Line Reticle Retroreflective Tester is a user-friendly handheld photoelectric instrument designed for precise on-site measurement of the photometric properties (retroreflection coefficient R’) of retroreflective materials. Specifically designed for quality inspection of traffic sign materials, this instrument is suitable for material manufacturers, quality supervision departments, engineering construction and supervision units, and can also meet the on-site testing needs of traffic safety management and highway, railway, and aviation departments for retroreflective signs. It can also test the reflective performance of reflective markings on truck bodies. The instrument consists of an optical system, a detection and amplification system, a power supply and control system, a display system, and a calibration block. A dedicated calibration block is included for calibration. The instrument uses an LCD digital display to present measured values and is powered by a lithium battery, ensuring accurate and reliable measurement results and ease of use.
Specifications:
| LISUN Model | LS-101C | LS-101A |
| Test Angles | Single-angles | Multi-angles |
| Observation angle (α) | 0.2° (accuracy: 0.002º) | 0º~2.0º (accuracy: 0.002º) |
| Angle of incidence (β) | -4° (accuracy: 0.1º) | -45º~+45º (accuracy: 0.1º) |
| Light Source | Standard A light source, color temperature 2856K | |
| Detector | Silicon diode, conforming to the CIE spectral luminous efficiency function V(λ). | |
| Monitor | LCD screen | |
| Retroreflection coefficient R’ measurement range | 0~3,000 cd/lx/m² | |
| Retroreflection coefficient R’ measurement accuracy | 0.1 cd/lx/m² | |
Instructions for use (taking LS-101A as an example):
1. Methods for Reading the Observation Angle (α) and the Angle of Incidence (β)
1.1 The optical detection head is equipped with adjustment devices for the observation angle (α) and the angle of incidence (β);
1.2 Method for reading the observation angle (α): The observation angle (α) can be adjusted by rotating the observation angle (α) adjuster. The observation angle adjuster consists of two parts (see the figure above): one part is a horizontal scale with 0, 5, and 10 markings, representing 0°, 1°, and 2° respectively. Each 1° is further divided into 10 graduations along the center line, so one graduation represents 0.1°; the other part is a micrometer tumbler with 50 graduations on its circumference. Every 5 graduations are marked with 10 graduations, such as 5, 10, …, 45, 0, so every 5 graduations represent 0.01°; each bisector represents 0.002°. Therefore, the combination of the scale and the micrometer tumbler can be used to read the degree values of the observation angle and the angle of incidence. Similarly, the angle value of any observed angle (α) can be read.
1.3 Method for reading the angle of incidence (β): The angle of incidence (β) is adjusted using a guide rail composed of two semi-circular plates. A scale with 1° graduations is attached to the end face of one semi-circular plate, with 0° at the center and 50° graduations at each end (±10°, ±20°…±50°). A line on the side of the support plate closest to the scale indicates the angle of incidence (β). Loosening the positioning screw of the angle of incidence (β) changes the angle of incidence (β). The value of the angle of incidence (β) can be read based on the position of the indicator line on the scale. The scale is marked with “+” and “-” symbols to indicate the direction of the angle of incidence.
2. Measurement of Retroreflection Coefficient (R′)
2.1 Instrument Installation and Pre-Measurement Preparation
2.1.1 Remove the instrument from its case and place the measuring display and incident angle dial on the worktable. Remove the optical detection head and insert its bottom end into the angle dial, aligning the indicator line on the detection head with the indicator line on the angle dial. Tighten the fixing bolts.
2.1.2 Turn on the measuring display switch.
2.2 Measurement Steps
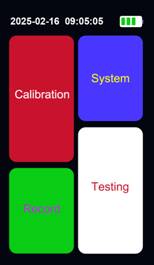
2.2.1 After pressing the power switch, the startup interface will be displayed. After warm-up, the main interface will appear; see the figure below:
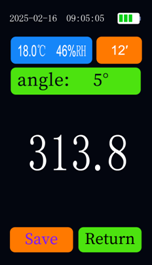
2.2.2 Adjust the observation angle adjuster to 0.2° and the incident angle adjuster to -4°. Place the black calibration plate at the center positioning notch of the incident angle dial base plate. Click “Measure” to enter the main measurement interface. Select the observation angle as 0.2° and the incident angle as -4°. Click “Data Display Position Measurement.” The measured result should be 0 (-2 to 2 are collectively referred to as 0). Then place the color calibration plate at the light metering aperture. After clicking “Measure,” the result should be the same as the given value (a deviation of ±2% is considered the same). If the measured value is accurate, replace it with the reflective film being measured and measure directly. The measurement interface is shown in the figure below. Other angle measurements are the same as above. After adjusting the observation angle and incident angle, select the corresponding angle on the screen and measure and verify using the above method.
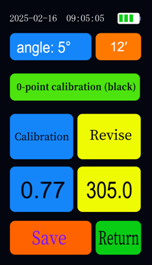
2.2.3 If the measured value differs from the displayed value, the instrument should be calibrated. Taking a 0.2° observation angle and a -4° incident angle as an example, adjust the observation angle to 0.2° using the observation angle adjuster, and adjust the incident angle adjuster to -4°. The display will return to the main interface. Click “Calibrate” to enter the calibration interface. Select an observation angle of 0.2° and an incident angle of -4°. Place the black calibration plate at the light metering aperture and click “0-point calibration (black)”. A calibration prompt box will appear. After the 0-point calibration is completed, check if the data in the correction column is consistent with the given value on the calibration plate. If not, click on the data in that column, modify the data to be consistent, and then click “Save”. Place the color calibration plate at the light metering aperture. Click “Calibrate”. A prompt box will appear. After the prompt box disappears, “OK” will appear. Click “Save” and the instrument will automatically return to the main interface to enter the measurement interface for measurement. The calibration interface is shown in the following figure:
2.3 After measurement, click “Save” to save the current measurement data and the current temperature and humidity.
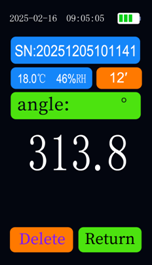
2.4 Click “Search” on the main interface to view the saved data. See the image below.
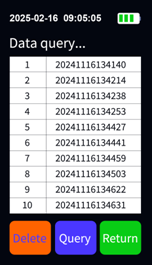
The data naming convention is: year, month, day, hour, minute, second. For example, 20241116134140 means the data saved on November 16, 2024, at 13:41:40. Clicking “Delete” will delete all saved data. Selecting a row of data and clicking “Search” will display detailed information about the currently stored data, as shown in the image below. Clicking “Delete” will delete the current data.
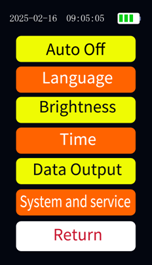
On the main interface, click Settings to modify basic parameters. Click Settings to enter the settings interface as shown in the image below. Click Auto Power Off to bring up the Auto Power Off time settings (Auto Power Off only turns off the screen to enter low-power mode; clicking the screen will wake the device). Click Language Selection to choose Chinese or English. Click Backlight Adjustment to bring up the backlight adjustment box; enter the backlight value (1 for dimmest, 10 for brightest). Click Time Settings to set the date. Click Data Export to export stored data to a TF card for viewing on a computer. Click System and Services to view after-sales service contact information and version information. Click Back to return to the main interface.
3. Data Export:
All data saved during measurement is stored on the motherboard. Clicking “Data Export” will export the stored data to a TF card. After ejecting the memory card, connect it to a computer using a card reader to export the saved data. The data storage type is CSV file, which can be opened directly in Excel without installing any host computer software. The naming convention for data storage files is year, month, day, hour, minute, and second.

 中文简体
中文简体