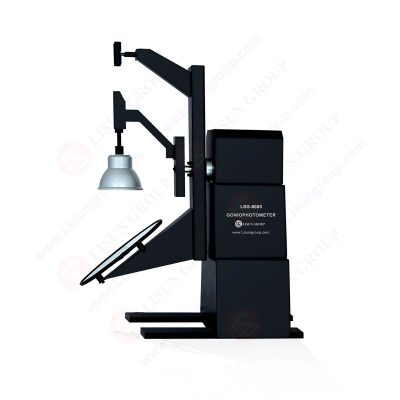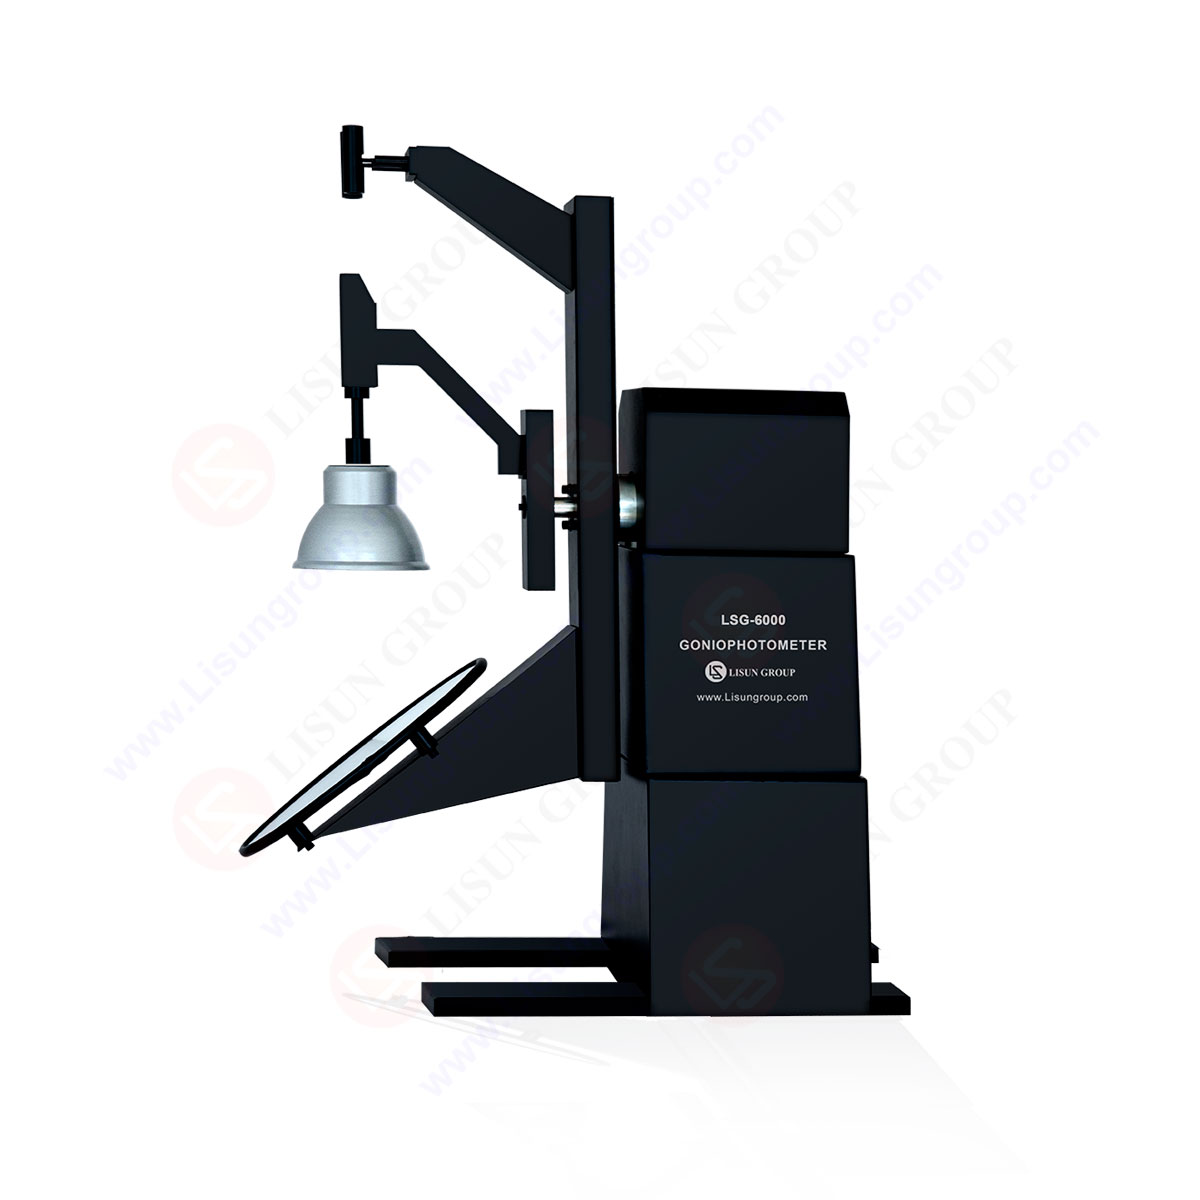
LM-79 Moving Detector Goniophotometer (Mirror Type C)
LSG-6000
High Precision Rotation Luminaire Goniophotometer
LSG-1890B
High Precision Rotation Luminaire Goniospectroradiometer
LSG-1890BCCD
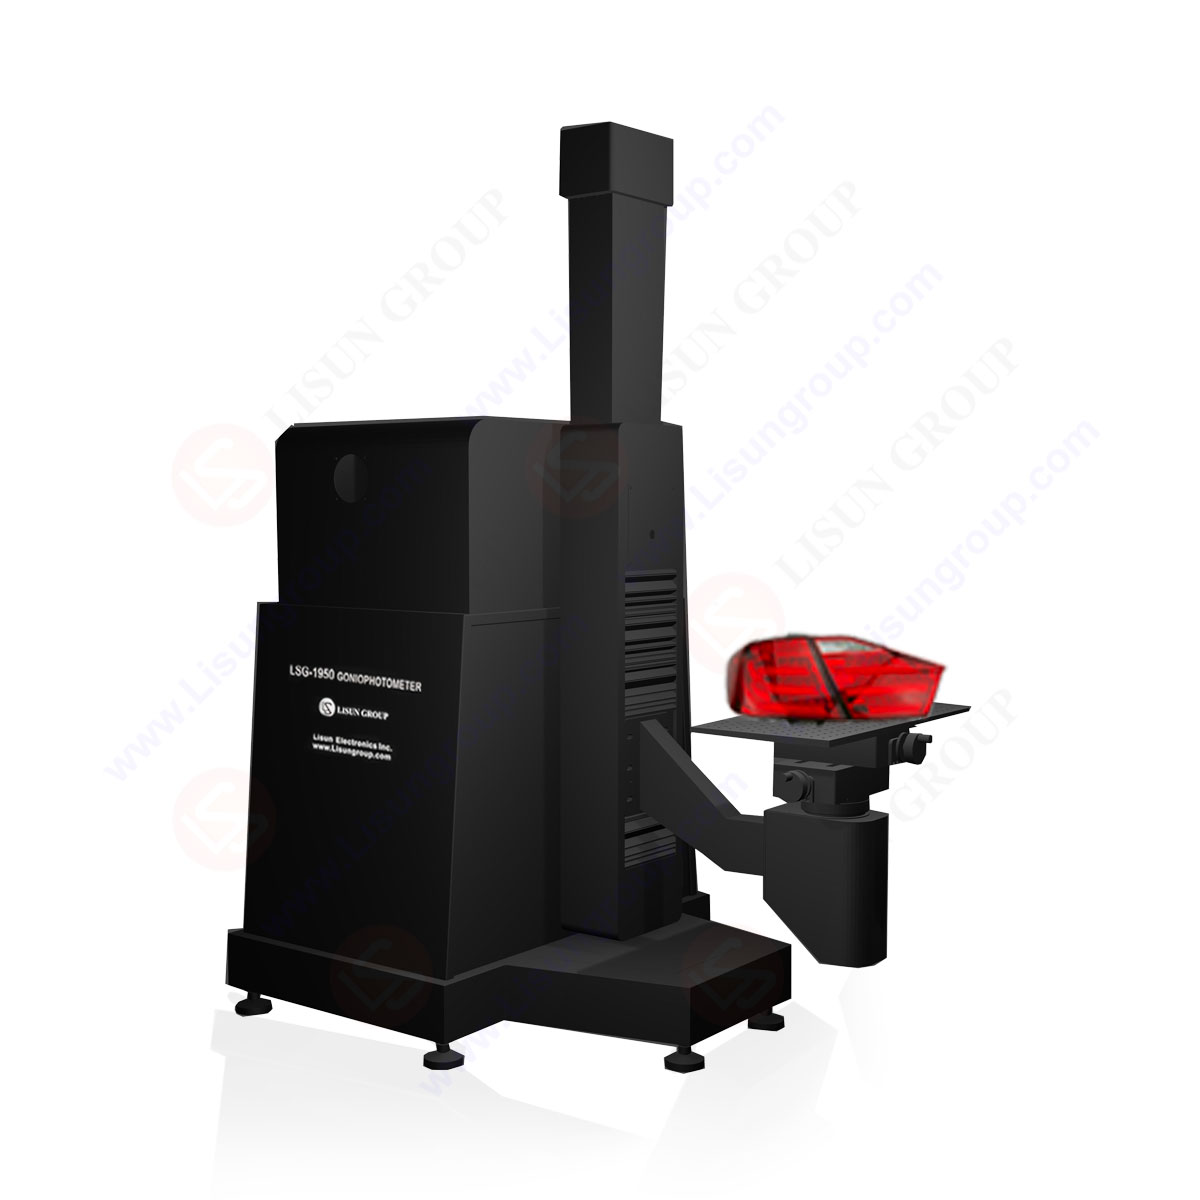
Goniophotometer for Automotive and Signal Lamps
LSG-1950
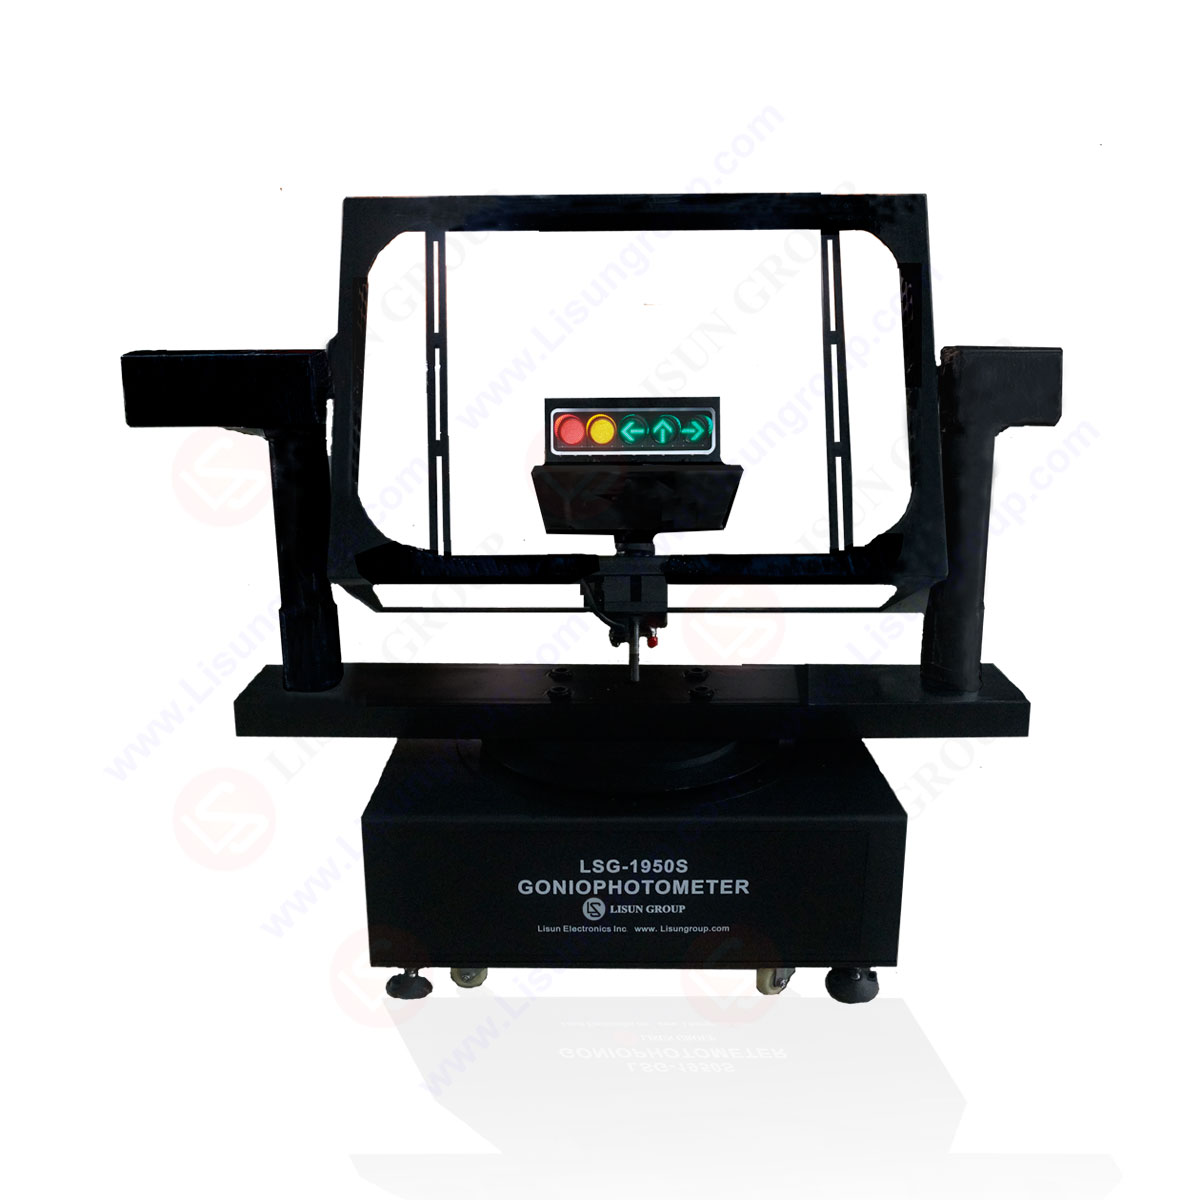
Goniophotometer for Traffic Signal Lamps
LSG-1950S
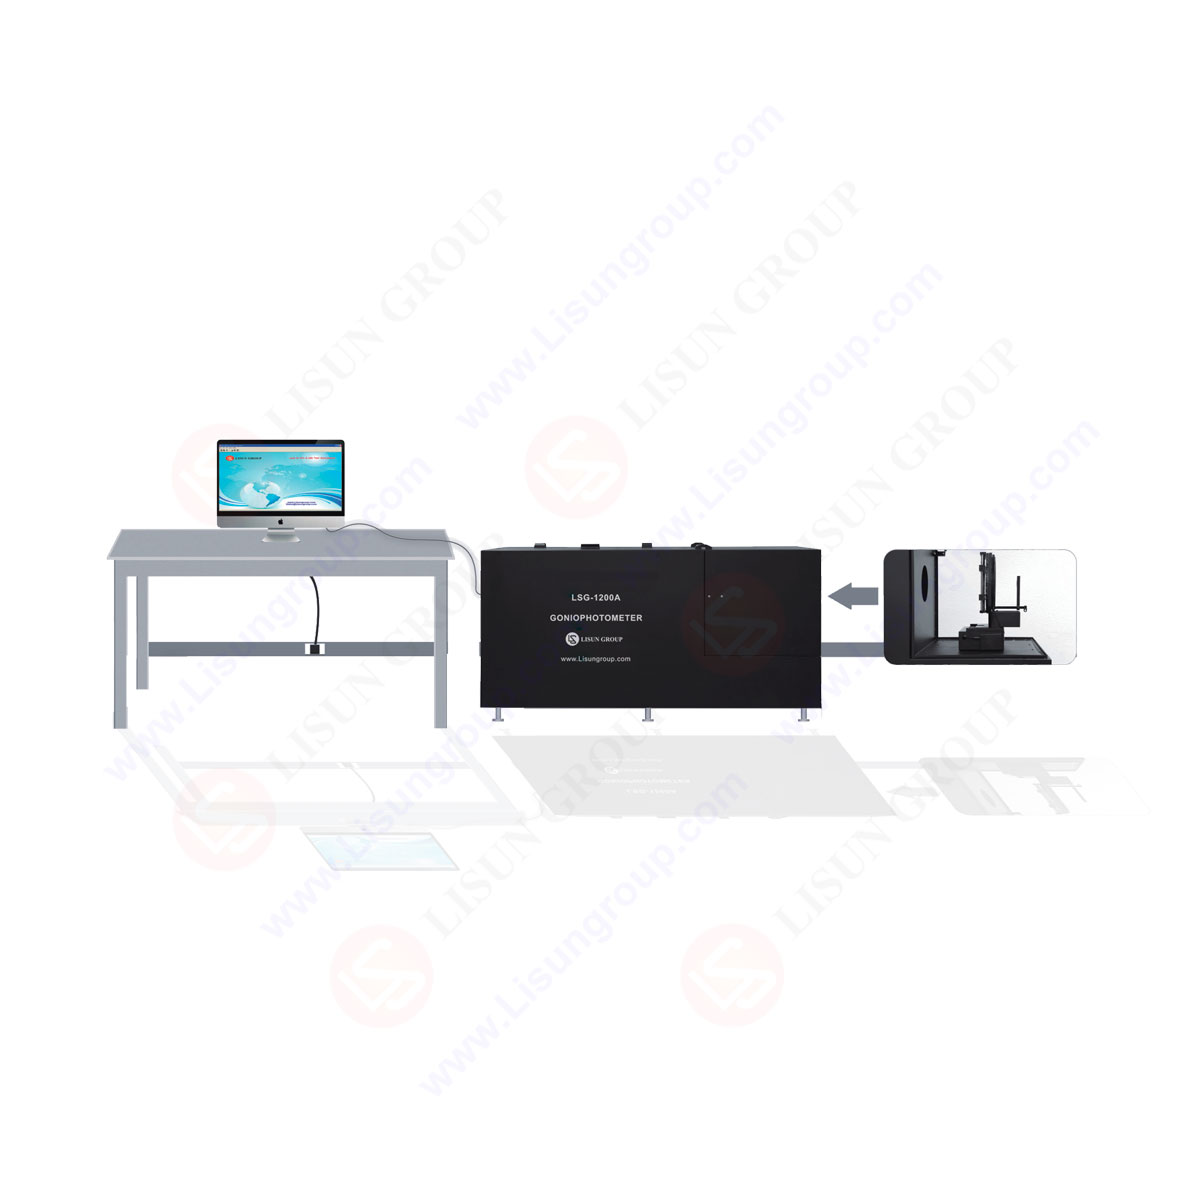
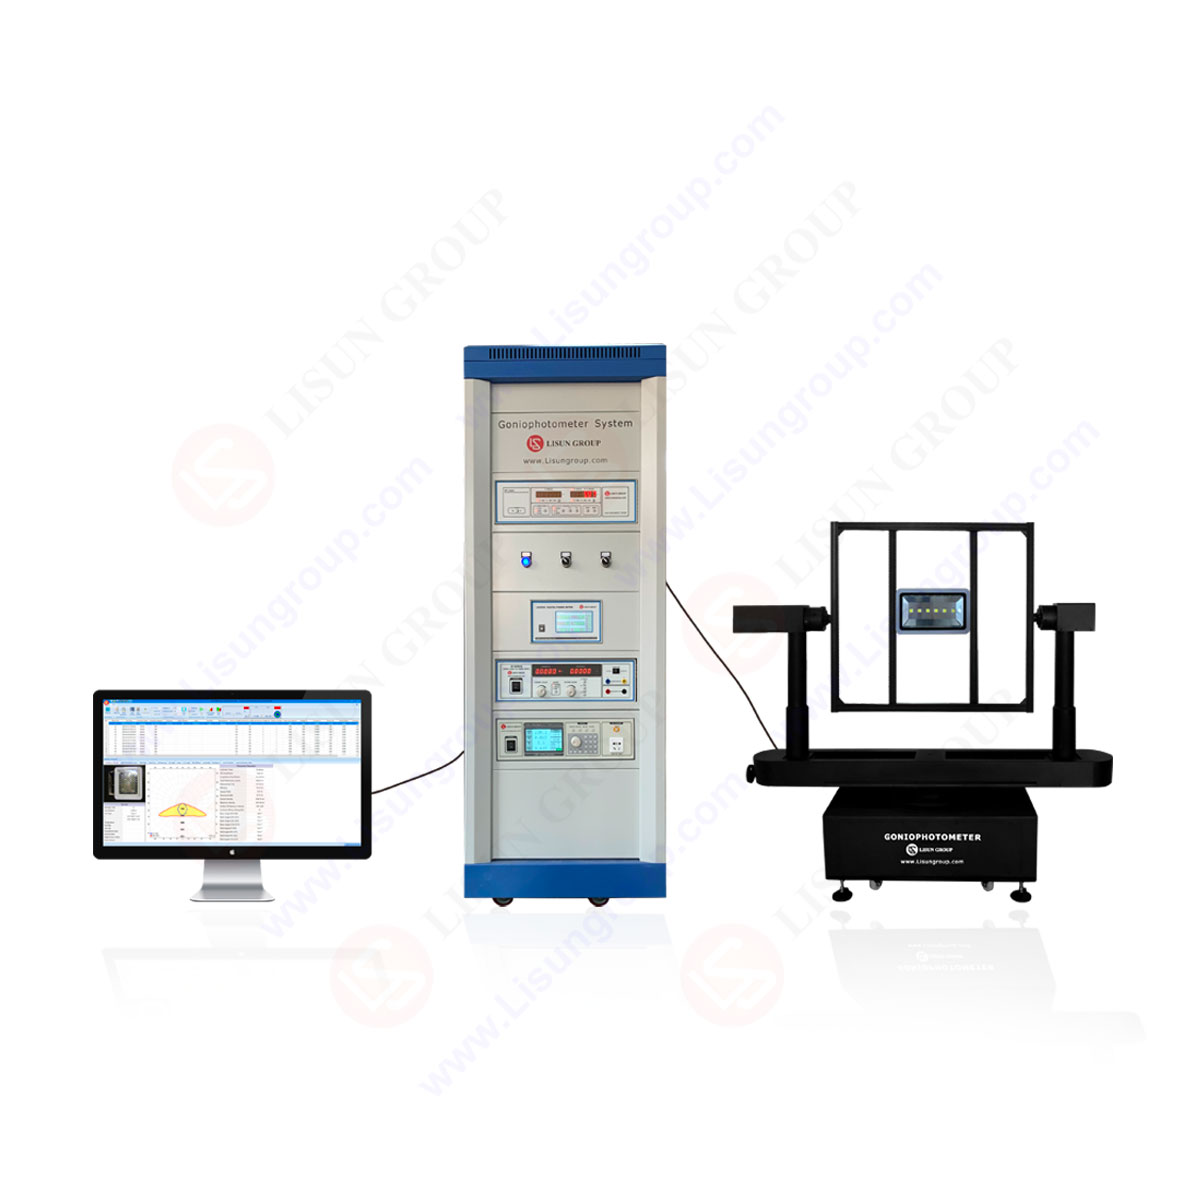
Compact Goniophotometer
LSG-1200A

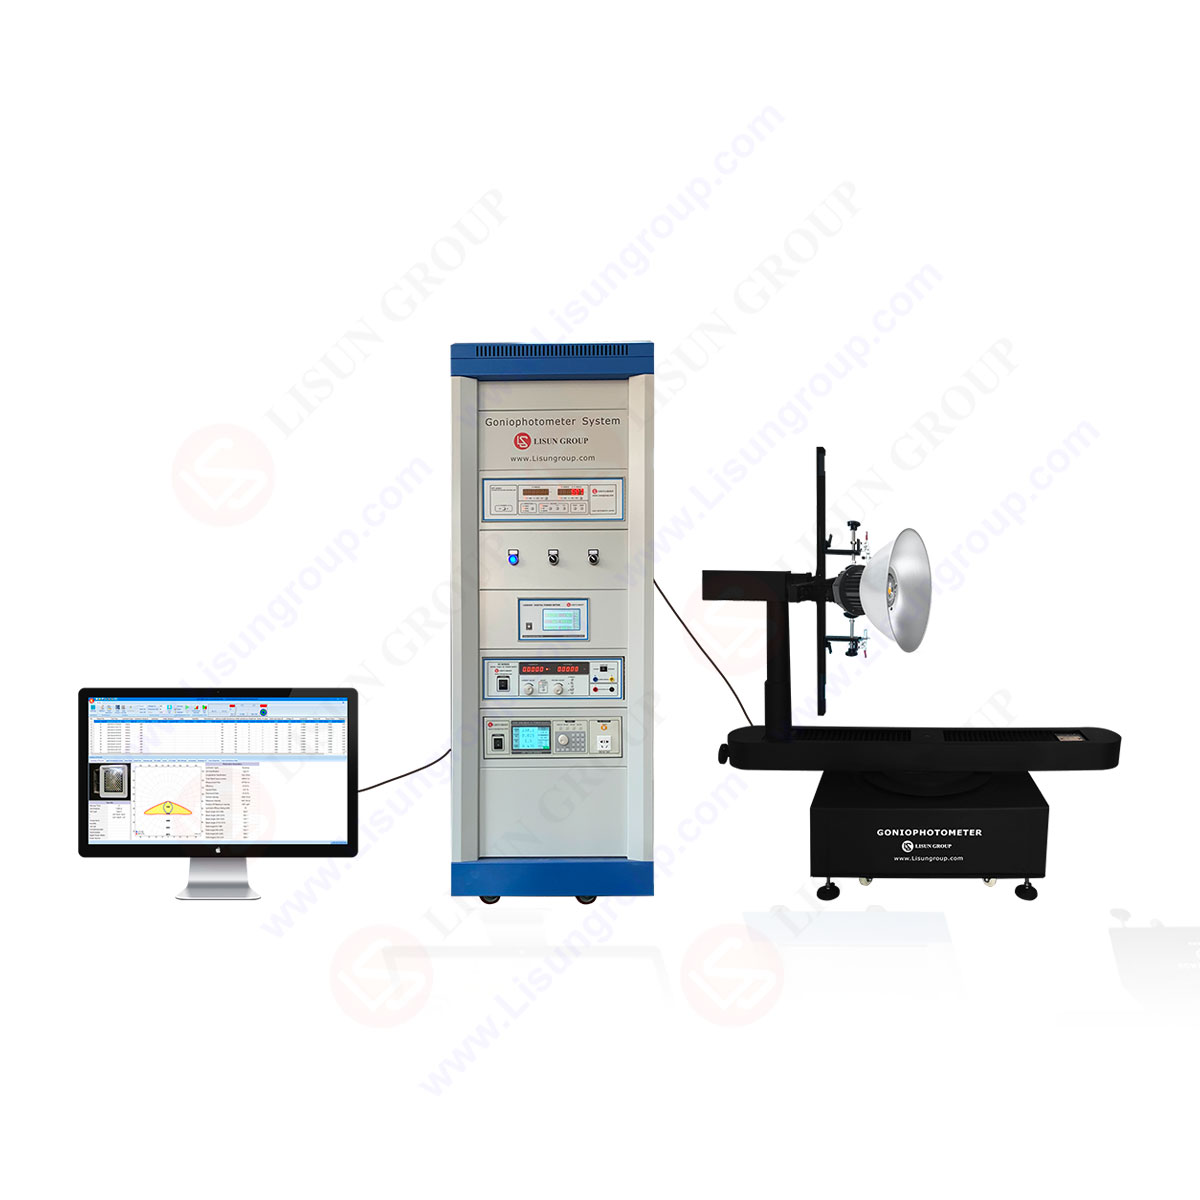
Near Field Moving Detector Goniophotometer
LSG-1900B
Select an organization
to browse standards
Definition of light distribution curve:
It refers to the light intensity distribution of light sources (or lamps) in all directions in space. On the metering plane passing through the center of the light source, the light intensity values of the lamps at different angles are measured. Starting from a certain direction, the light intensity of each angle is marked with a vector with the angle as a function, and the connection connecting the top of the vector is the polar coordinate light distribution curve of the lighting fixture. If the luminaire has a rotationally symmetric axis, only the light intensity distribution curve on a photometric surface passing through the axis can be used to illustrate the spatial distribution of its light intensity. If the light distribution of the luminaire in space is asymmetrical, it requires the light intensity distribution curves of several photometric planes can explain the spatial distribution of light intensity.
The two most common expressions of light distribution curve

Cartesian coordinate notation
For condensing lamps, because the beam is concentrated in a very narrow solid angle, it is difficult to express the spatial distribution of its light intensity in polar coordinates, so the right-angle light distribution curve representation method is used, and the vertical axis represents the light intensity show as picture 1. Use the horizontal axis to indicate the projection angle of the beam. If it is a luminaire with a symmetrical axis of rotation, only one light distribution curve is needed to represent it, and if it is an asymmetrical luminaire, it needs multiple light distribution curves to represent it.

Polar coordinate notation
On the metering plane passing through the center of the light source, the light intensity values of the lamps at different angles are measured. Starting from a certain direction, the light intensity of each angle is marked with a vector with the angle as a function, and the connection connecting the top of the vector is the polar coordinate light distribution curve of the lighting fixture. If the luminaire has a rotationally symmetrical axis, only the light intensity distribution curve on a photometric surface passing through the axis can be used to illustrate the spatial distribution of its light intensity. If the light distribution of the luminaire in space is asymmetrical, it requires the light intensity distribution curves of several photometric planes can explain the spatial distribution of light intensity.

Graphical light distribution curve
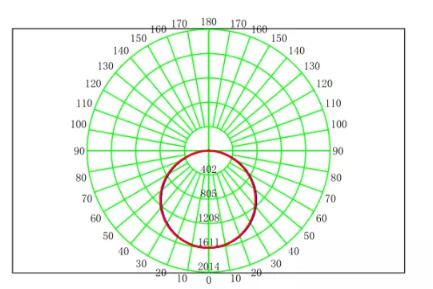
Note 1: (Peak center light intensity)
Peak light intensity: It can be seen from the figure that Imax=1611cd, and the magnitude of the peak light intensity determines the intensity and illuminance of the illumination. (Of course the factors that affect the illuminance and intensity are also related to the angle of the reflector and the irradiation distance)
Note 2: (50% peak light intensity)
50% peak light intensity: 1/2 Imax=805.5cd, here is mainly to see the beam angle.
Note 3: (Half angle)
Half-height angle: On the plane where the maximum light intensity is selected, the angle between two of 50% of the maximum light intensity is called the half-height angle. From the above figure, it can be seen that the sum of 60° on the left and right is approximately equal to 120°. The size of the beam angle determines the size of the spot, which is closely related to the illumination effect.
Note 4: (10% peak light intensity)
Effective beam angle: On the plane where the maximum light intensity is selected, the angle between two 10% of the maximum light intensity is called the effective beam angle of the plane. It can be seen from the figure above that the sum of about 80° on the left and right is approximately equal to 160°.

Illumination distance relationship graph
The illuminance distance relationship diagram describes the parameter changes of the lamps on the working surface at different heights.
H: The illumination height of the lamp under test
E0: Center illuminance
DH/DV: The diameter of the horizontal axis and the vertical axis of the irradiation spot
S-B: The area of the irradiated area
EAV: The average illuminance of the illuminated area

Luminaire effective average illuminance graph
1: The luminous flux emitted by the lamp in the relative beam angle
2: The corresponding beam angle can be set in the system settings
3: The luminous flux output in the upper left corner of the above figure refers to the luminous flux within the beam angle.
Note: It is important to note that the luminous flux output in the above figure is not equal to the actual luminous flux of the lamp. The difference is that the luminous flux output lumens can be displayed in different angles according to the angle set in the system, and the luminous flux of the lamp is the actual instrument tested data.

Brightness limit curve
Luminance limit curve: (Civil architectural lighting design standard GBJ133-90) adopts the luminance limit curve of lamps recommended by CIE as the standard and method for evaluating direct glare of indoor general lamps in our country. Industrial and civil lighting design standards stipulate that the direct glare of indoor general lighting is also limited according to the brightness limit curve.
Direct glare: It is caused by the direct glare of lights or lamps directly entering the field of vision. The severity of the glare effect depends on the size of the light-emitting surface of the luminaire, the brightness of the light-emitting surface, the background brightness, the viewing direction and location, the illuminance level and the reflectance of the room surface, etc. The brightness of the light source (lamp or window) is the most important.

UGR table
UGR refers to the unified glare value, the full English name (Unified Glare Rating).
The psychological parameter used to measure the subjective response of the light emitted by the lighting device in the indoor visual environment to the uncomfortable feeling of the human eye, and its value can be calculated with the CIE unified glare value formula according to the prescribed calculation conditions.
The psychological parameter that measures the subjective response of the light emitted by the lighting device in the indoor visual environment to the uncomfortable feeling of the human eye, and its value can be calculated with the CIE unified glare value formula according to the prescribed calculation conditions.
The original industrial and civil lighting design standards stipulate that the direct glare of indoor general lighting is limited according to the brightness limit curve. This limitation method is only for the glare of a single lamp, and cannot represent the total glare effect of all lamps in the room.

In the formula: Lb——background brightness (cd/m2);
Iα—The direction of the line connecting the luminous center of the luminaire and the observer’s eye
Luminous intensity of lamps (cd);
P—the position index of each individual luminaire, ω—the solid angle formed by the light-emitting part of each luminaire to the observer’s eyes;
In 1995, CIE proposed to use UGR as a quantitative index for evaluating uncomfortable glare. The subjective perception of uncomfortable glare corresponding to its numerical value is consistent with the glare index of the United Kingdom. The UGR is classified as follows:

UGR classification
Subjective feeling of uncomfortable glare corresponding to UGR value:
|
UGR value |
Subjective feelings of uncomfortable glare |
|
28 |
Severe glare, unbearable |
|
25 |
Glare, discomfort |
|
22 |
There is glare, just a sense of discomfort |
|
19 |
Slight glare, tolerable |
|
16 |
Slight glare, negligible |
|
13 |
Very light glare, no discomfort |
|
10 |
No glare |
So what are the precautionary measures to reduce UGR?
(1) Reduce the brightness of the glare source;
(2) Improve environmental brightness and reduce the contrast between glare brightness and environmental brightness;
(3) Replace the smooth reflective surface with a rough reflective surface;
(4) Adjust the position of the glare source to keep it away from the observer’s line of sight;
(5) Use honeycomb nets to block glare sources.
(Note: Under the premise of reducing UGR, we must first of all need customer needs, not blindly reducing lumens and power, etc.)
What is an IES file
The IES file is the electronic format of the light source (lamp) light distribution curve file, because its extension is “*.ies”, so we usually call it the IES file directly.
The meaning of the IES file is customized and implemented by the North American Illumination Association. It is now a default file format for storing the spatial light intensity distribution of the light source in many regions.
What is the purpose of IES files
I believe that after reading the above introduction to the IES file, everyone understands that the so-called IES is like a person’s information record, recording a series of information about lamps and lanterns. Since it is information, it can be consulted. The below is talking about the use of IES files.
1. In the final analysis, IES is a luminaire. Import it into the lighting application software. Calculation software such as AGI and DIALux can import IES files for use, and you can see all the light distribution parameters and luminous flux of this luminaire.
2. Using IES files, we can save a lot of practical time and directly calculate what effect will be achieved by installing this lamp in a certain area.
3. The lighting design project can be made more quickly.
Typical lighting application of IES light distribution curve

Commercial lighting such as downlights

Outdoor lighting
Lisun Instruments Limited was found by LISUN GROUP in 2003. LISUN quality system has been strictly certified by ISO9001:2015. As a CIE Membership, LISUN products are designed based on CIE, IEC and other international or national standards. All products passed CE certificate and authenticated by the third party lab.
Our main products are Goniophotometer, Integrating Sphere, Spectroradiometer, Surge Generator, ESD Simulator, EMI Receiver, EMC Test Equipment, Electrical Safety Tester, Environmental Chamber, Temperature Chamber, Climate Chamber, Thermal Chamber, Salt Spray Test, Dust Test Chamber, Waterproof Test, RoHS Test (EDXRF), Glow Wire Test and Needle Flame Test.
Please feel free to contact us if you need any support.
Tech Dep: Service@Lisungroup.com, Cell/WhatsApp:+8615317907381
Sales Dep: Sales@Lisungroup.com, Cell/WhatsApp:+8618917996096
LISUN’s indoor and outdoor LED test solutions meet IEC 60598-1, IEC 62722-2-1, CIE 121 standards, covering safety, photometry, and environmental tests for global compliance.

 中文简体
中文简体