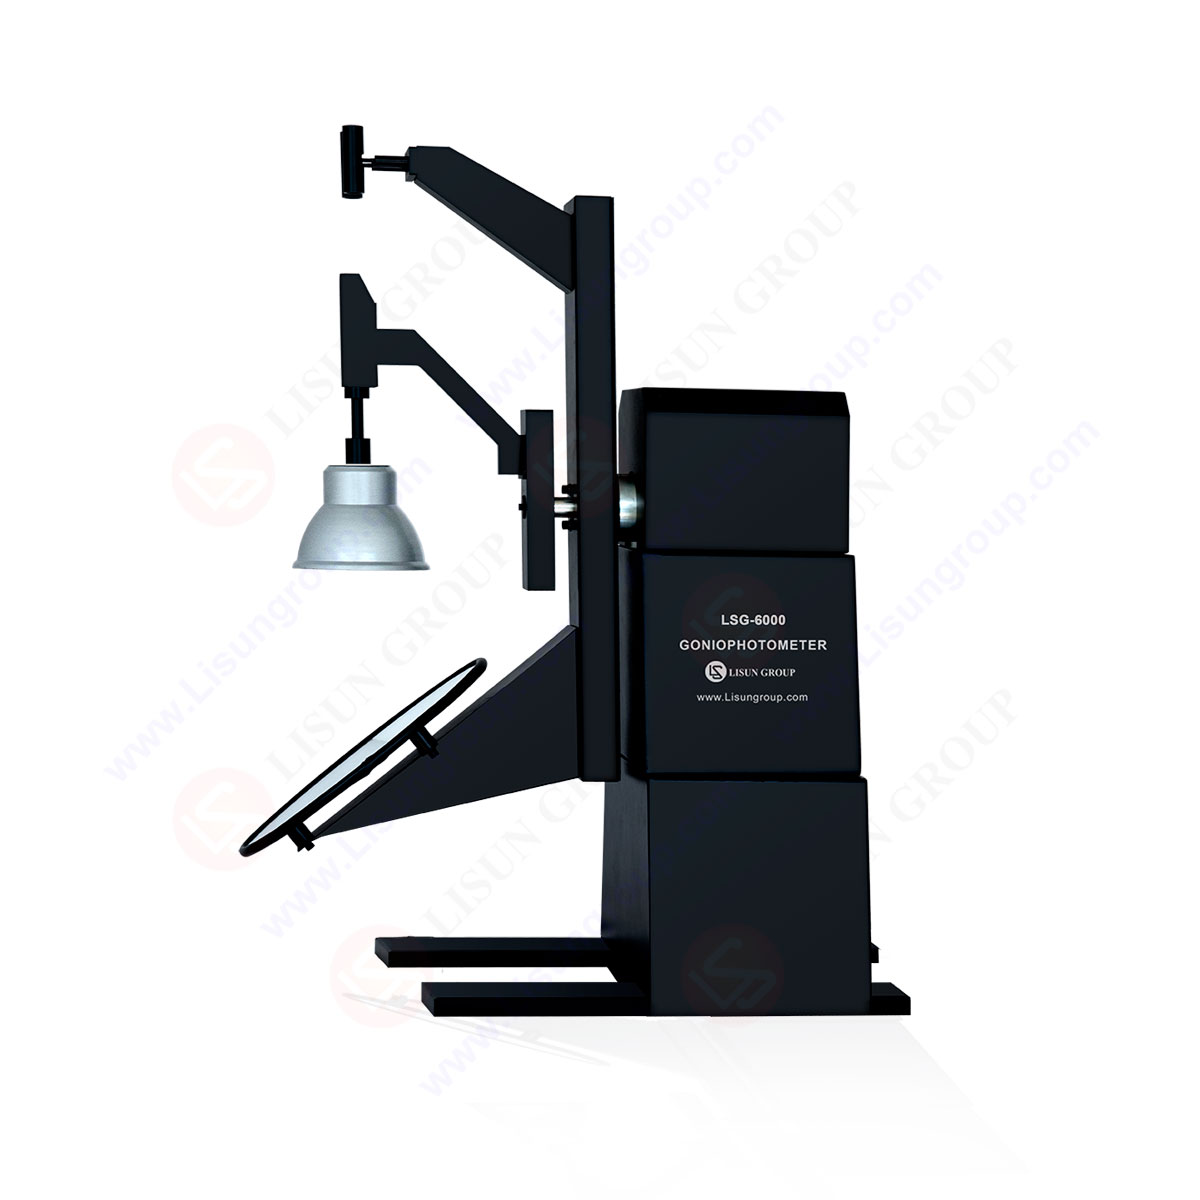
LM-79 Moving Detector Goniophotometer (Mirror Type C)
LSG-6000
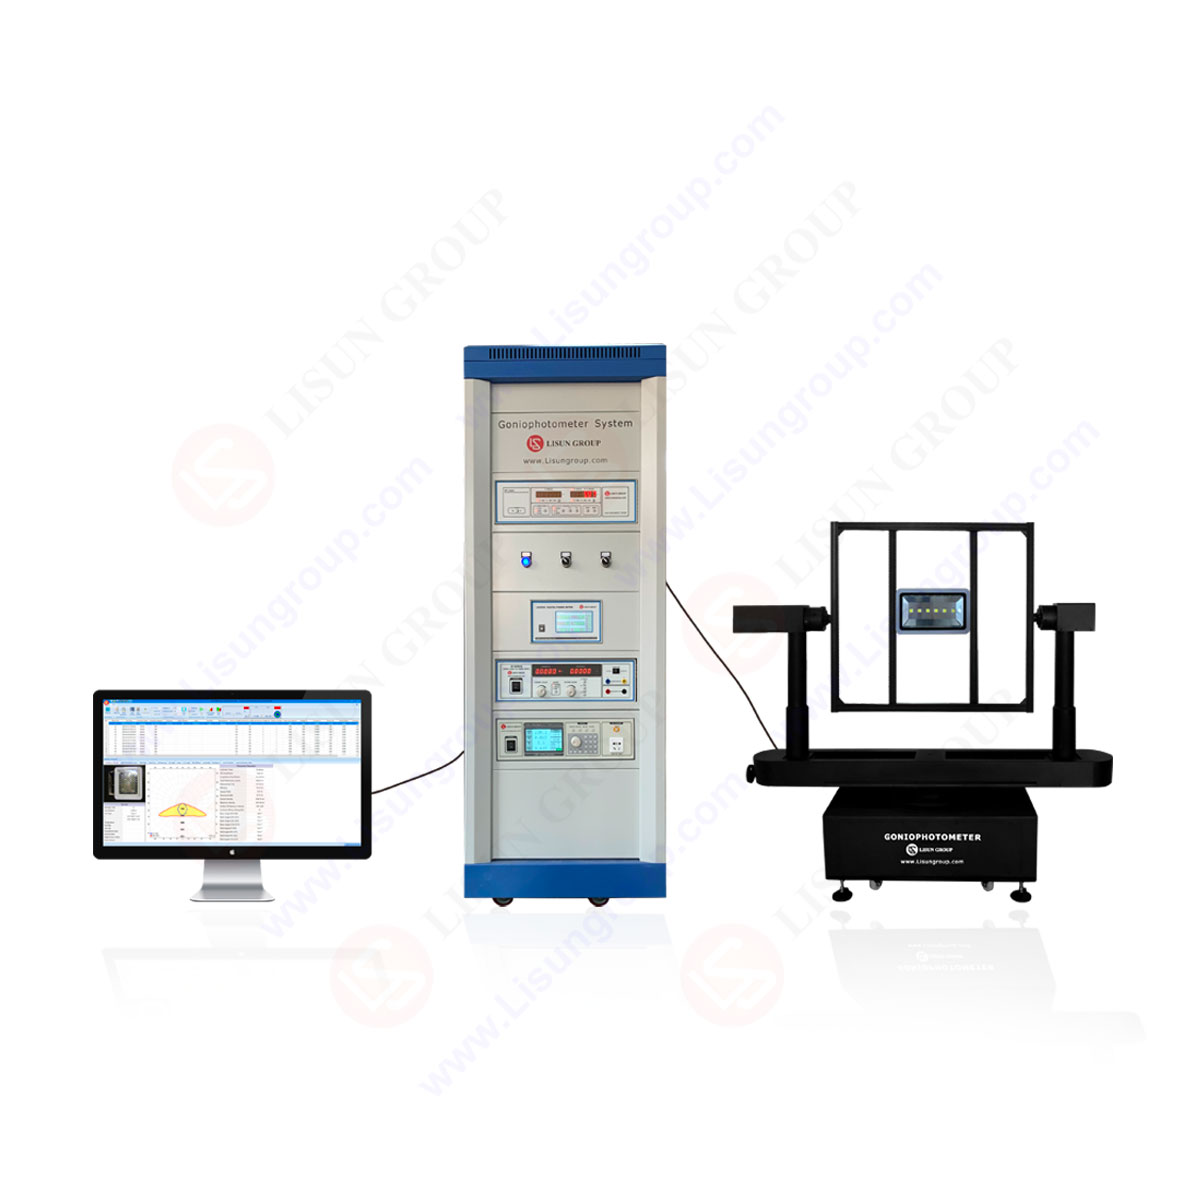
High Precision Rotation Luminaire Goniophotometer
LSG-1890B
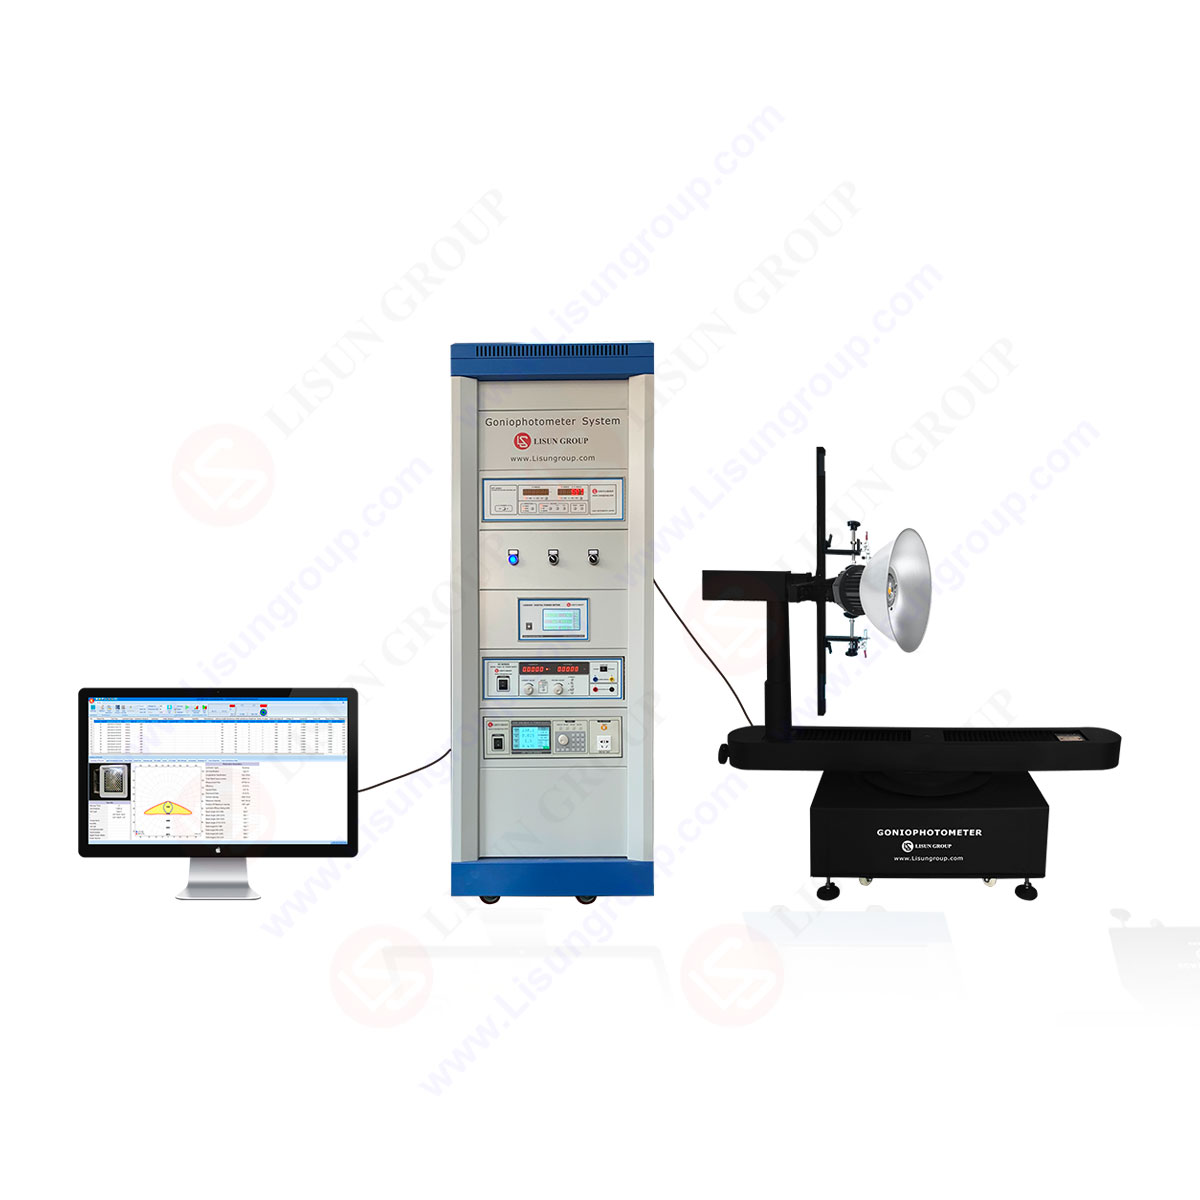
High Precision Rotation Luminaire Goniospectroradiometer
LSG-1890BCCD
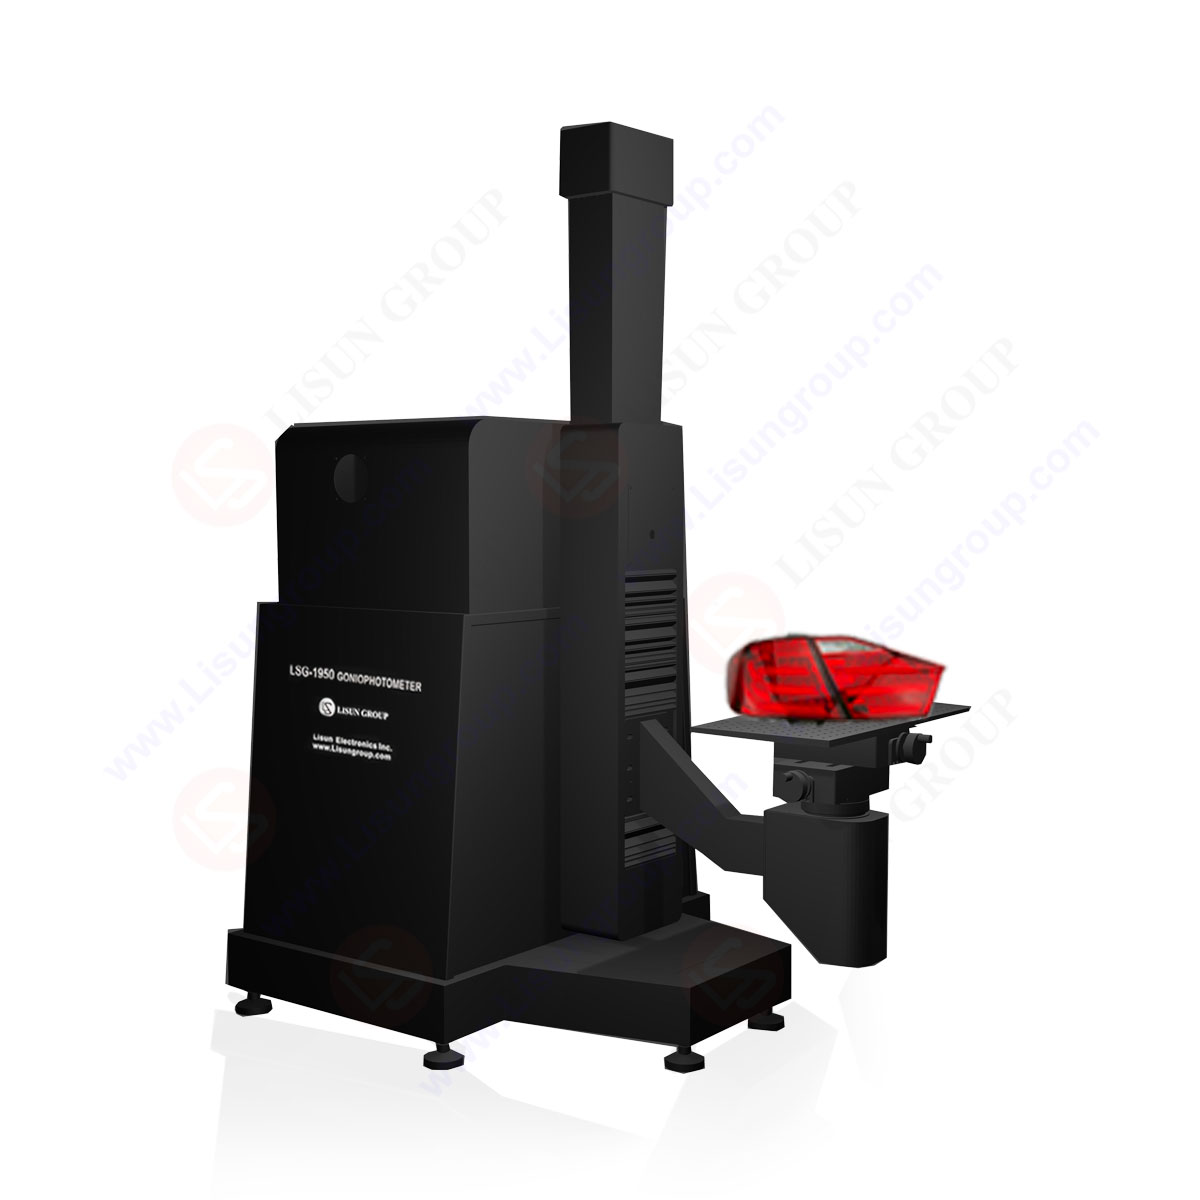
Goniophotometer for Automotive and Signal Lamps
LSG-1950
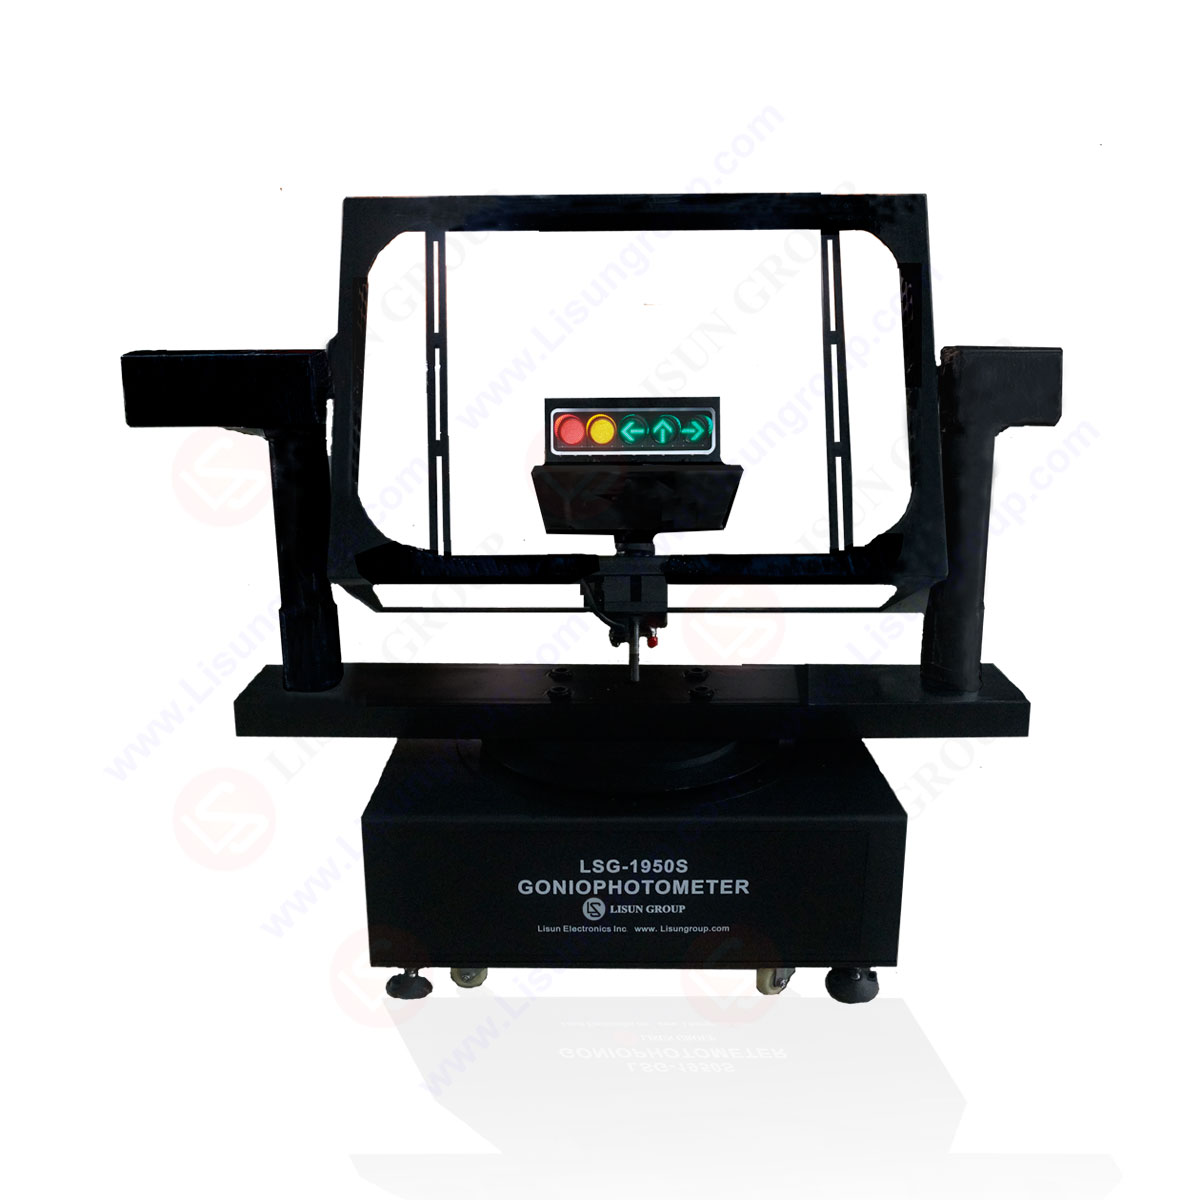
Goniophotometer for Traffic Signal Lamps
LSG-1950S
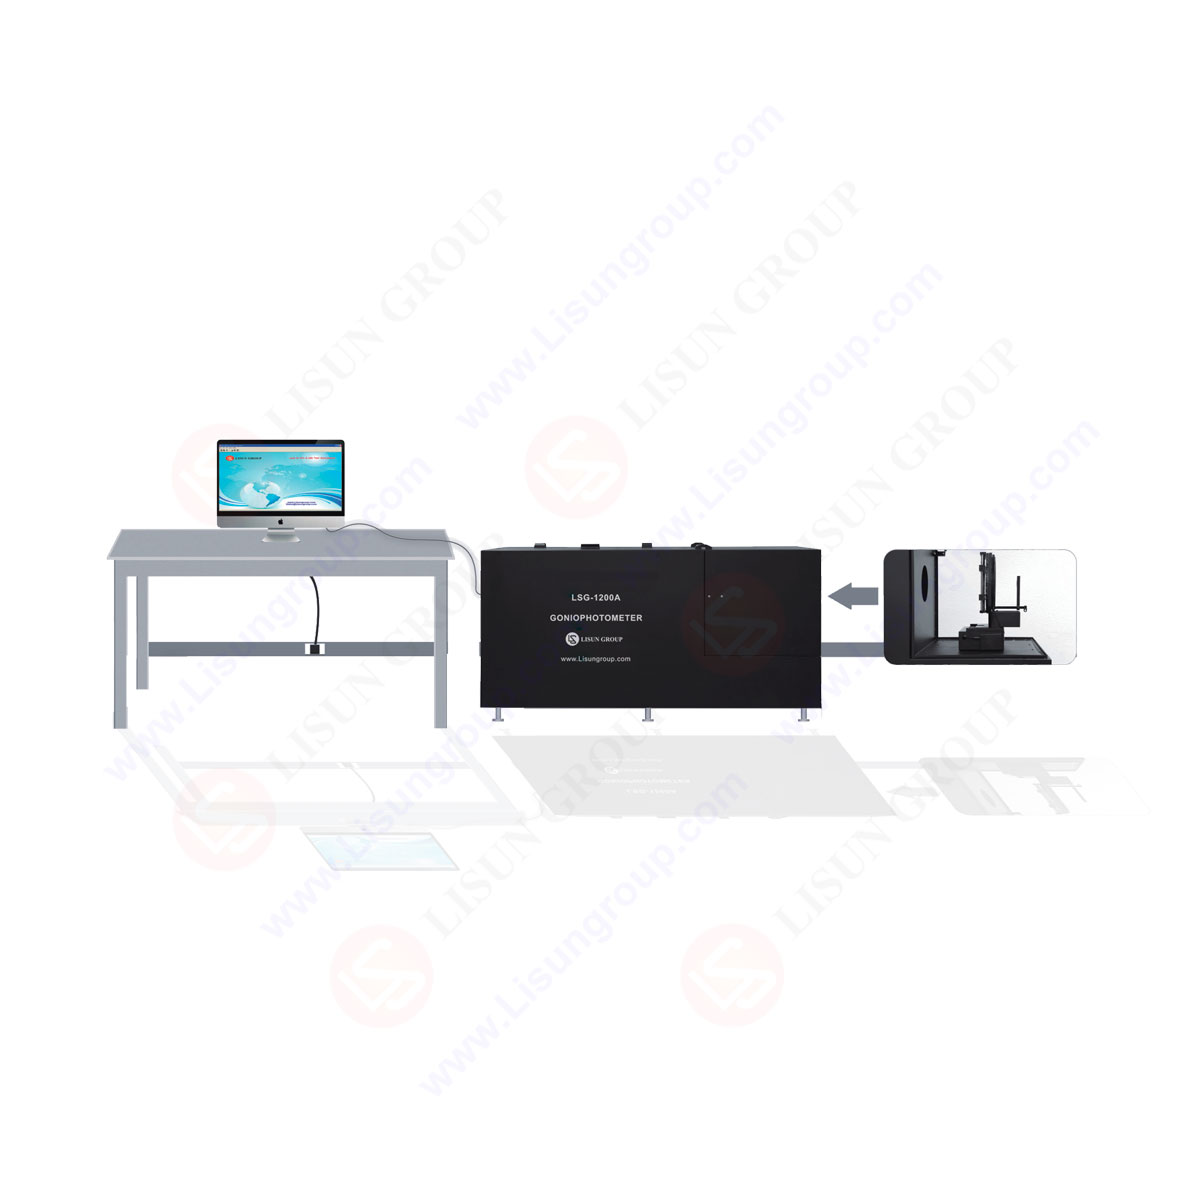
Compact Goniophotometer
LSG-1200A

Near Field Moving Detector Goniophotometer
LSG-1900B
Select an organization
to browse standards
Definition of CIE 1931 chromaticity coordinates:

Chromaticity coordinate
The colors in the figure include the colors that nature can get. This is a two-dimensional planar space diagram, a plane composed of an x-y right-angle scale. It was designed to accommodate people’s habit of discussing variable relationships in a planar coordinate system. In the process of designing the graph, many mathematical transformations and calculations were undertaken. The meaning and function of this figure can be summarized into two sentences: (1) It represents the basic law of color vision. (2) Indicates the general law of color mixing and decomposition.
1. Coordinate system – x, y Cartesian coordinate system.
x – represents the relative magnitude in relation to red.
y – represents the relative magnitude associated with green.
z – represents the relative magnitude associated with blue. and z=1-(x+y)
2. Shape and contour lines
Shape – tongue shape, sometimes called “tongue curve” diagram. A closed area surrounded by a tongue-shaped peripheral curve and a straight line at the bottom. Tongue-shaped peripheral curve – is the color trajectory line of all visible monochromatic light, each point represents the color of a certain wavelength of monochromatic light, wavelengths from 390nm to 760nm. Next to the curve. The corresponding wavelengths of some characteristic color points are marked. For example, 510nm – 520nm – 530nm in the figure. Bottom line – a straight line connecting the 390nm point to the 760nm point, this line is called the purple red line.
3. Color
This is a color map of the colors in the area, including the colors that can be physically achieved. Unfortunately, such information, which is rarely available in true standards, is often distorted by transfers.
4. Application value – quantitative representation of color
Colors are represented by coordinate values of (x,y). White should be included in the concept of “color”.
5. The meaning of several feature points
(1) E point – the coordinate point of the equal energy white light point
The E spot is a mixture of three primary colors of light with the same stimulus light energy. However, the luminous fluxes of the three are not equal. CCT = 5400K at point E.
(2) A point – CIE specifies the chromaticity coordinate point of a standard white light source This is a pure tungsten lamp with a color temperature value CCT=2856.
(3) Point B – a standard light source coordinate point specified by CIE CCT=4874K of point B, representing direct daylight.
(4) Point C – a standard daylight source coordinate point (daylight) confirmed by CIE CCT=6774K of point C.
(5) D point – sometimes also marked as D light source is called typical daylight, or recombinant daylight; CCT=6500K。
6. Three special lines
(1) Blackbody color temperature trajectory line: In the middle of the tongue-shaped curve, across the white area, there is a downward curve, which is the blackbody color temperature trajectory line. This curve represents the trajectory of the blackbody’s luminous color at different temperatures. Color temperature varies from 1000K to infinity. But in fact, the 1000K-1400K range is commonly used.
(2) Monochromatic light trajectory line: that is, the tongue-shaped curve in the chromaticity coordinate diagram, the trajectory line of the color corresponding to the wavelength of visible light. Any point on the curve indicates the wavelength of a light and the color it represents.
(3) Purple-red line: a straight line connecting the two ends of the tongue-shaped curve. Represents the trajectory of the color after the red and purple are mixed. This is called the purple-red line
7. 20 specific color zones
The area surrounded by the tongue curve is divided into 20 color areas. In each region, the color is considered to be basically the same, and each color zone is an average dominant wavelength, or complementary dominant wavelength, and there is a corresponding English name. Their English-Chinese names, contrasted as follows:
1. Red—Red 2. Pink—pink 3. Reddis Orange – orange-red 4. Yellishpink—Pink 5. Orange—Orange 6. Orange-Yellow – Orange-Yellow 7. Yellow—yellow8.reenish yellow—yellow-green9. Yellow Green – Green-Yellow 10. Yellowish Green – pale yellowish green 11. Green—Green 12. Bluish Green – light blue-green 13, Greenish Blue – light greenish-blue 14. Blue—Blue 15. Purplish Blue—Lilac Blue 16. Purple Violet – Violet’s Purple 17. Reddish Purple – reddish purple 18. Purplish Pink—lilac pink 19. Purplish Red – Purple Red 20
8. Complementarity of light and color
If two colors of light can be mixed in a certain proportion to obtain white light, the two colors of light are called complementary. In the chromaticity diagram, a pair of complementary color lights can be found in any straight line that passes through the white area. Of course, passing through the straight ends of the E point of the isoenergy white light point, you can also find a complementary set of color light. In the chromaticity coordinate diagram, the light color of any two points connects the straight line of the two points, and the result of this light color mixing is always at a certain point on the line. If the line does not pass through the white area, the light color of the two points cannot be said to be complementary.
9. Mixing of white light with other colors of light—dominant wavelength and complementary dominant wavelength
Mix white light with an appropriate spectral color to match any color light you need. If the selected white light is E-point equivalent energy white light. Select any point C, connect CE and extend, intersect on the monochromatic trajectory line, then C’ monochromatic light wavelength, called the dominant wavelength of C point light. The dominant wavelength λ represents the dominant color of the spectral color at each point on the line. If point A in the FEN triangle is selected, the EA is connected, but it cannot be extended in the direction of A, but the line should be extended to the upper left and intersected at point A’ on the monochromatic trajectory line, then the wavelength of point A’ is called the complementary dominant wavelength of point A. The dominant wavelength of complementary color is also the dominant color representing the color of each point on the AA’ line.
10. Quantitative representation of color shades
The hue of the color field, similar to the intertone in music. A piece in music has C key, F key, etc., and in chromaticity it is indicated by the dominant wavelength. The pronunciation tones in music are high-pitched and low-pitched. In colorimetry, there are corresponding shades of color. The shade of color is expressed in terms of excitatory purity Pe. (Refer to the figure in section 11) Obviously, on the line, the color of the C’ point is dark, then gradually fades, and by point E it becomes completely white.
11. Mixing of colors and light
The xy chromaticity coordinate diagram can be used to represent the mixing relationship of any two color lights.
are two spectral colors on chromaticity coordinates. To mix two kinds of light, just connect the two points to get a straight line, and the color point of the color mixing must also be a point on the line.
12. Latitude of color
On the chromaticity coordinate diagram of XY, each point represents a definite color. The color of any point and the surrounding neighboring points should be different. But if the points are close together, the human eye cannot distinguish them. Only when the distance between the two points is large enough can we feel the difference. The range in which the human eye cannot perceive the color change is called the color wide capacity. Studies have shown that the wide capacity of colors is not the same at different locations on the chromaticity diagram. The wide capacity of the blue zone is small, and the wide capacity of the green zone is large. That is to say, the equal distance of different areas of the chromaticity diagram does not represent the visual difference in equal chromaticity. This is a defect of chromaticity diagrams.
LISUN lauched Portable Colorimeter/Chroma Meter is an innovation color measuring tool with powerful configuration to make color measurement easier and more professional; It support Bluetooth to connect with Android and ISO devices, Portable Colorimeter/Chroma Meter will take you into a new world of color management; It can be widely used to measure color value, color difference value and find similar color from color cards for printing industry, paint industry, textile industry, etc.

CD-320PRO_Portable Colorimeter/Chroma Meter
Lisun Instruments Limited was found by LISUN GROUP in 2003. LISUN quality system has been strictly certified by ISO9001:2015. As a CIE Membership, LISUN products are designed based on CIE, IEC and other international or national standards. All products passed CE certificate and authenticated by the third party lab.
Our main products are Goniophotometer, Integrating Sphere, Spectroradiometer, Surge Generator, ESD Simulator Guns, EMI Receiver, EMC Test Equipment, Electrical Safety Tester, Environmental Chamber, Temperature Chamber, Climate Chamber, Thermal Chamber, Salt Spray Test, Dust Test Chamber, Waterproof Test, RoHS Test (EDXRF), Glow Wire Test and Needle Flame Test.
Please feel free to contact us if you need any support.
Tech Dep: Service@Lisungroup.com, Cell/WhatsApp:+8615317907381
Sales Dep: Sales@Lisungroup.com, Cell/WhatsApp:+8618117273997
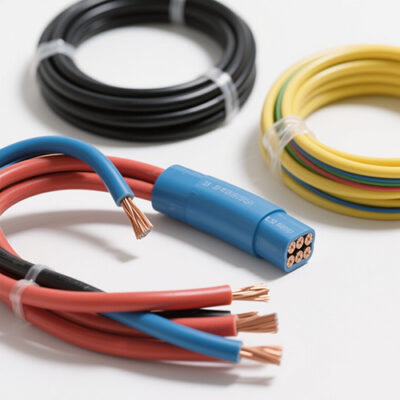
LISUN’s cable and wire test solutions meet IEC 60245-1, IEC 60227-1, IEC 60502-1 and IEC 60189 standards, covering electrical, mechanical, and safety tests for global compliance.
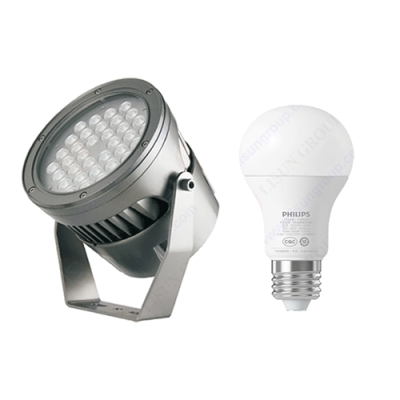
LISUN’s indoor and outdoor LED test solutions meet IEC 60598-1, IEC 62722-2-1, CIE 121 standards, covering safety, photometry, and environmental tests for global compliance.

 中文简体
中文简体