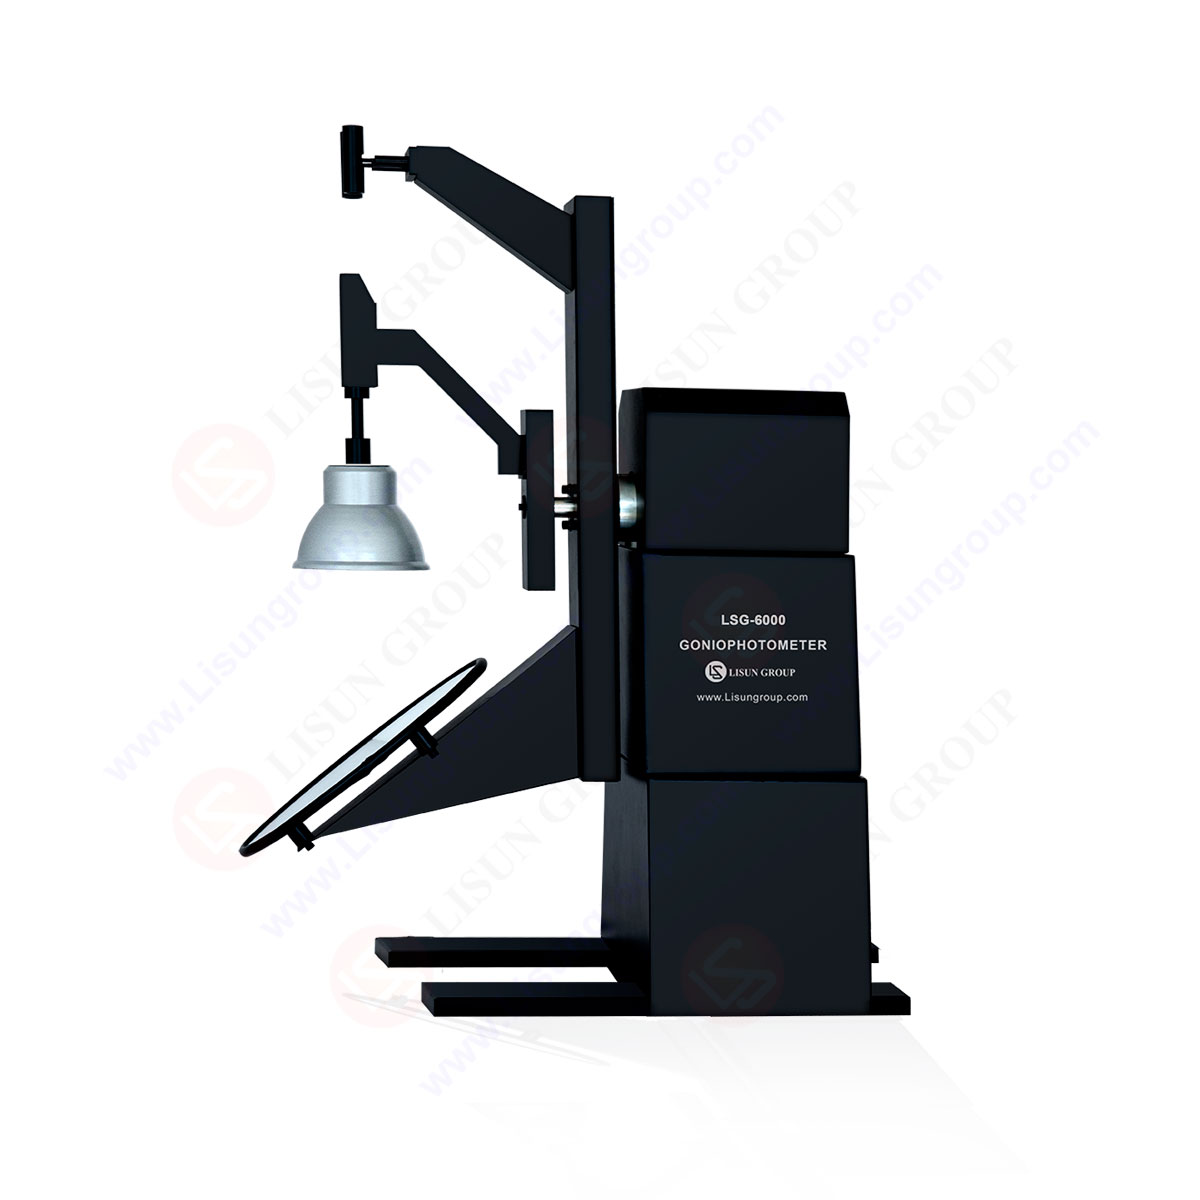
LM-79 Moving Detector Goniophotometer (Mirror Type C)
LSG-6000
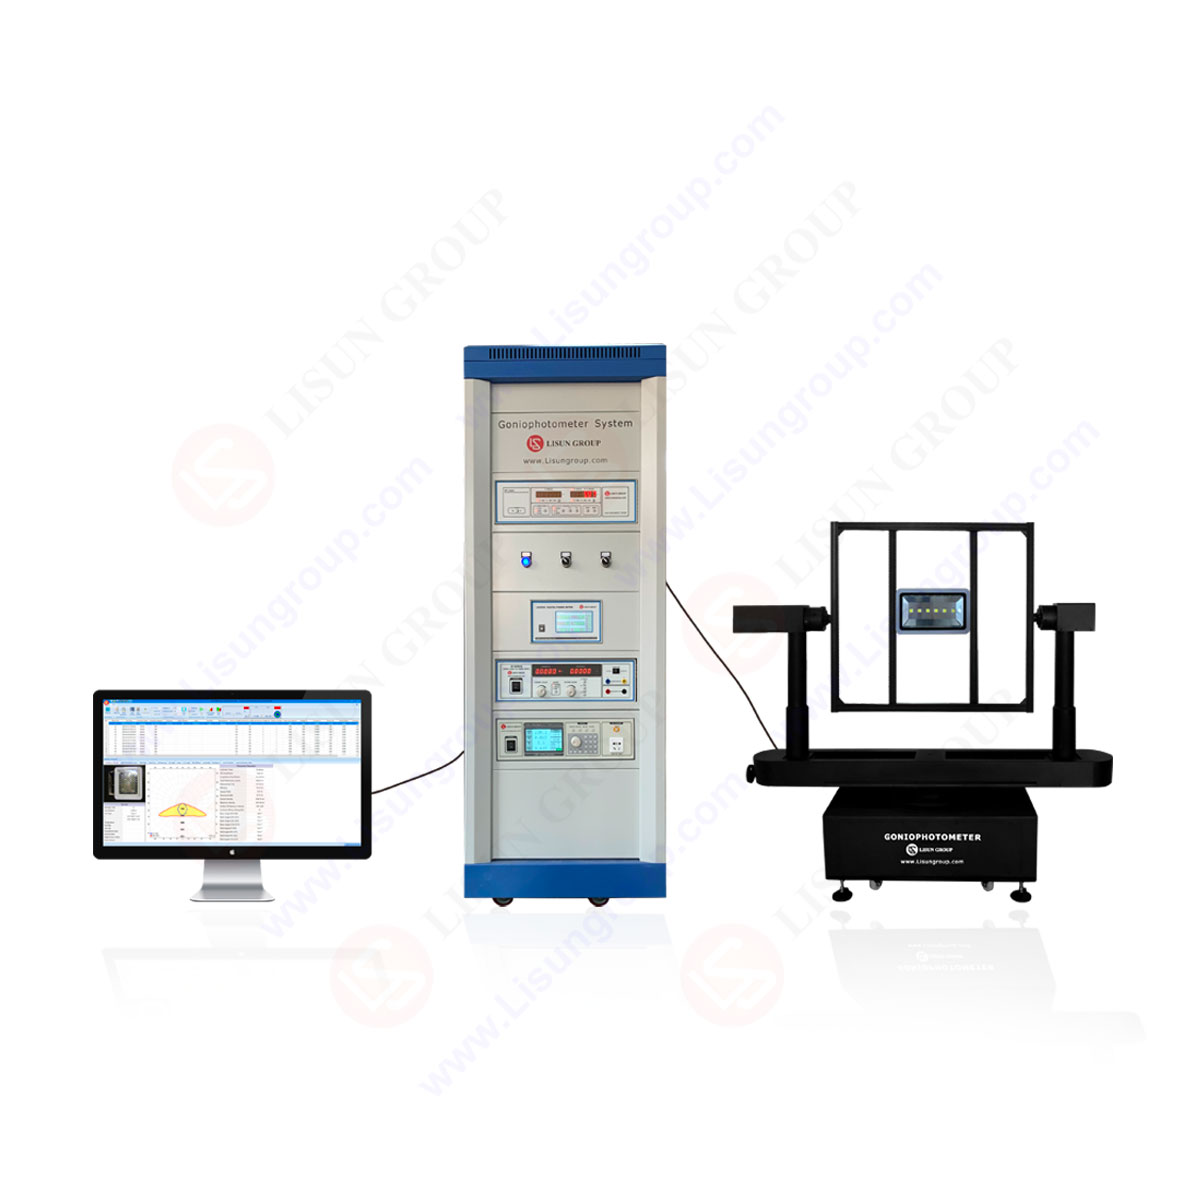
High Precision Rotation Luminaire Goniophotometer
LSG-1890B
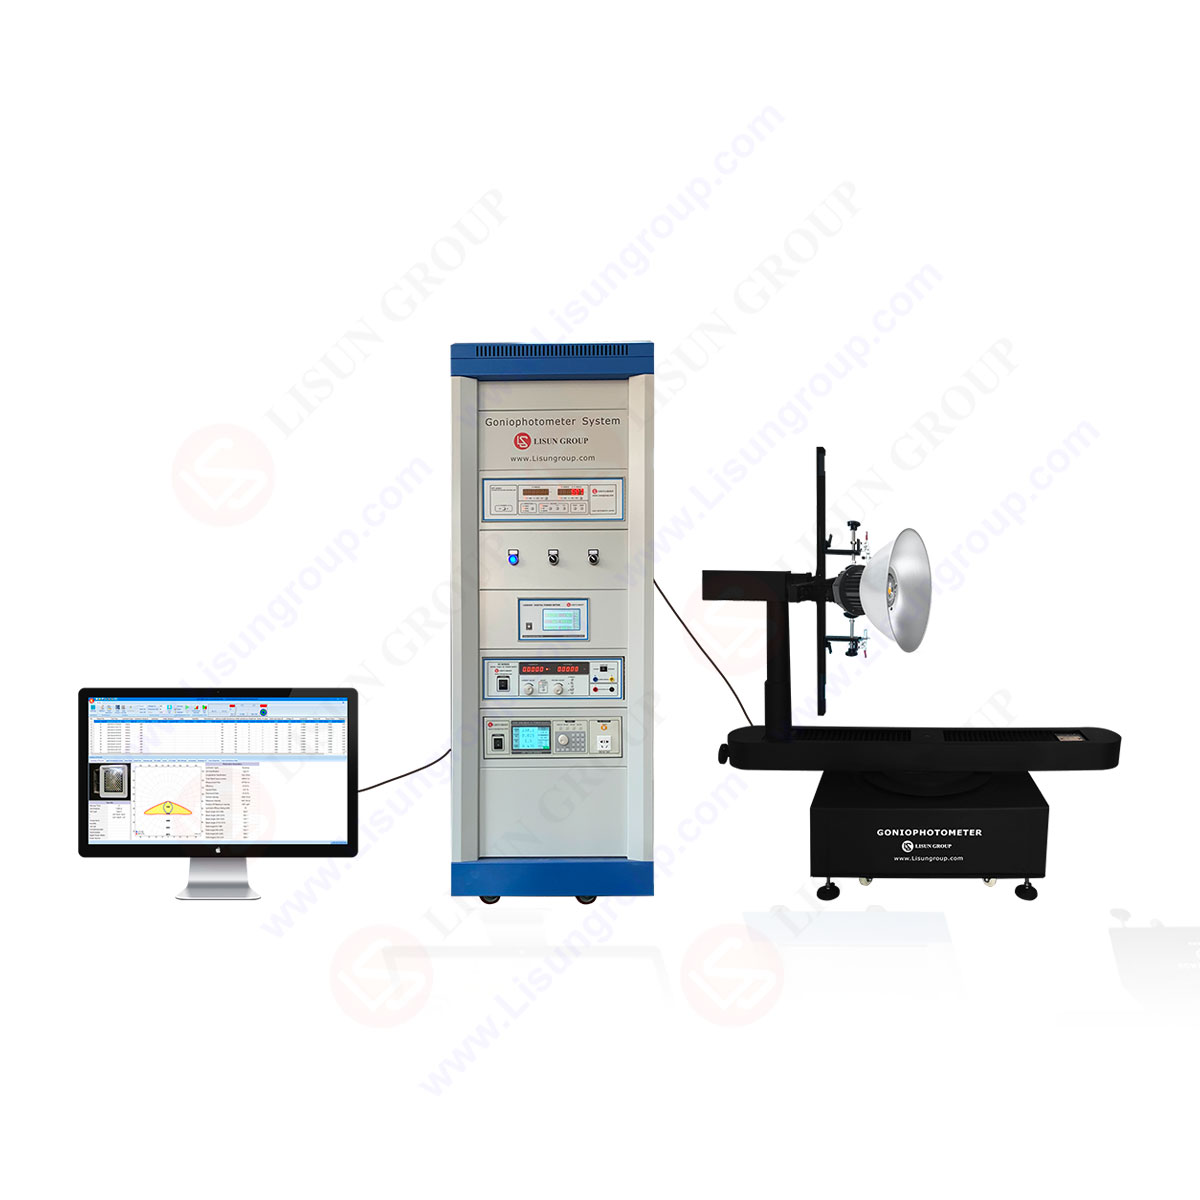
High Precision Rotation Luminaire Goniospectroradiometer
LSG-1890BCCD
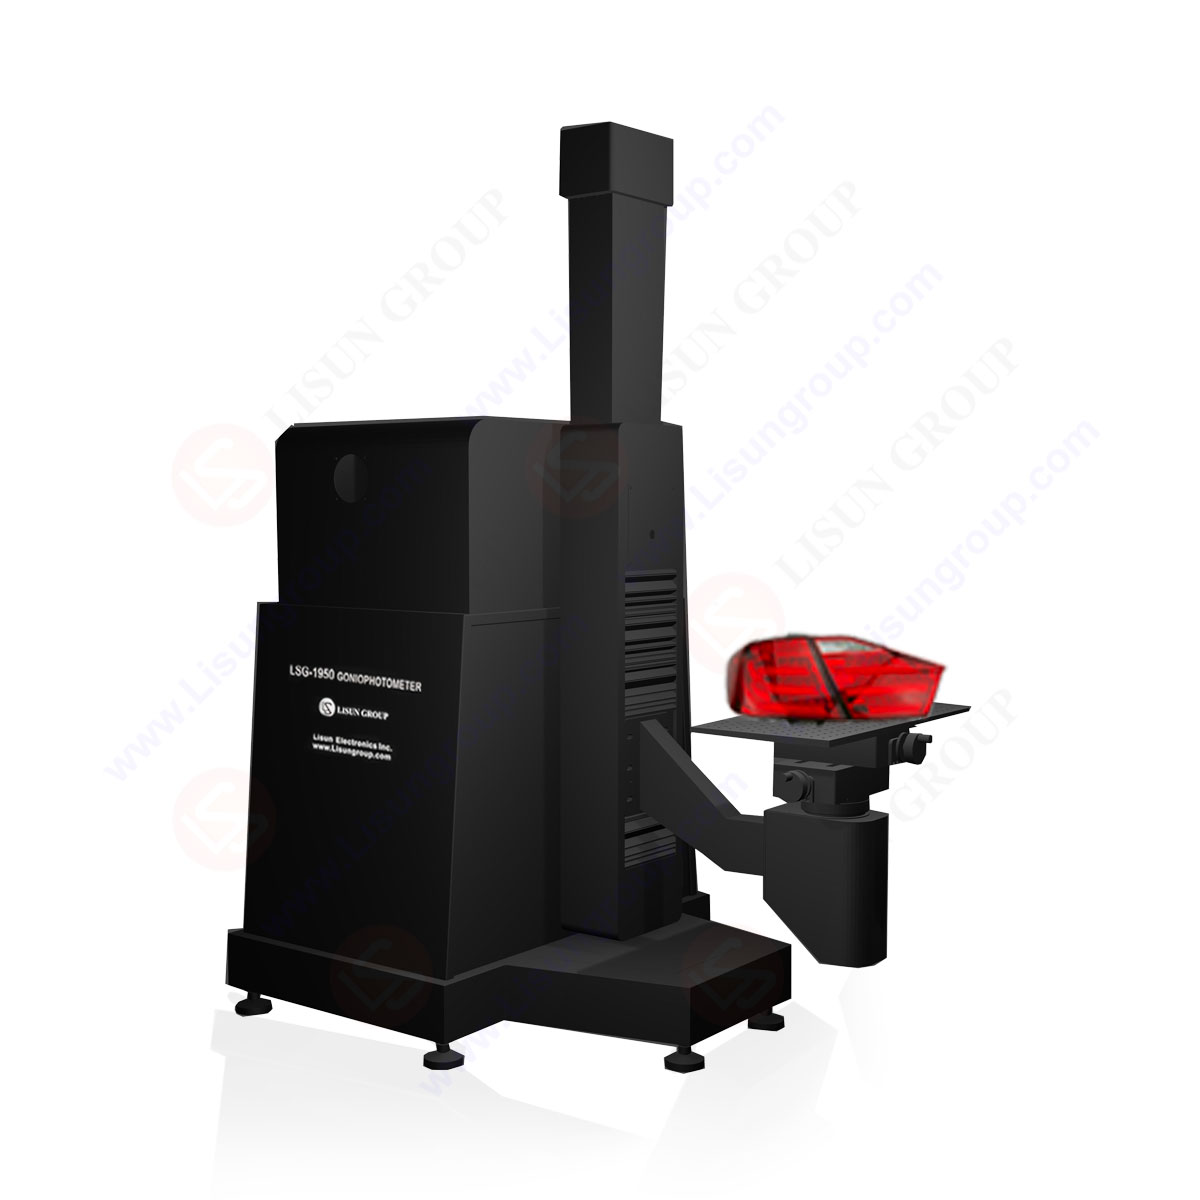
Goniophotometer for Automotive and Signal Lamps
LSG-1950
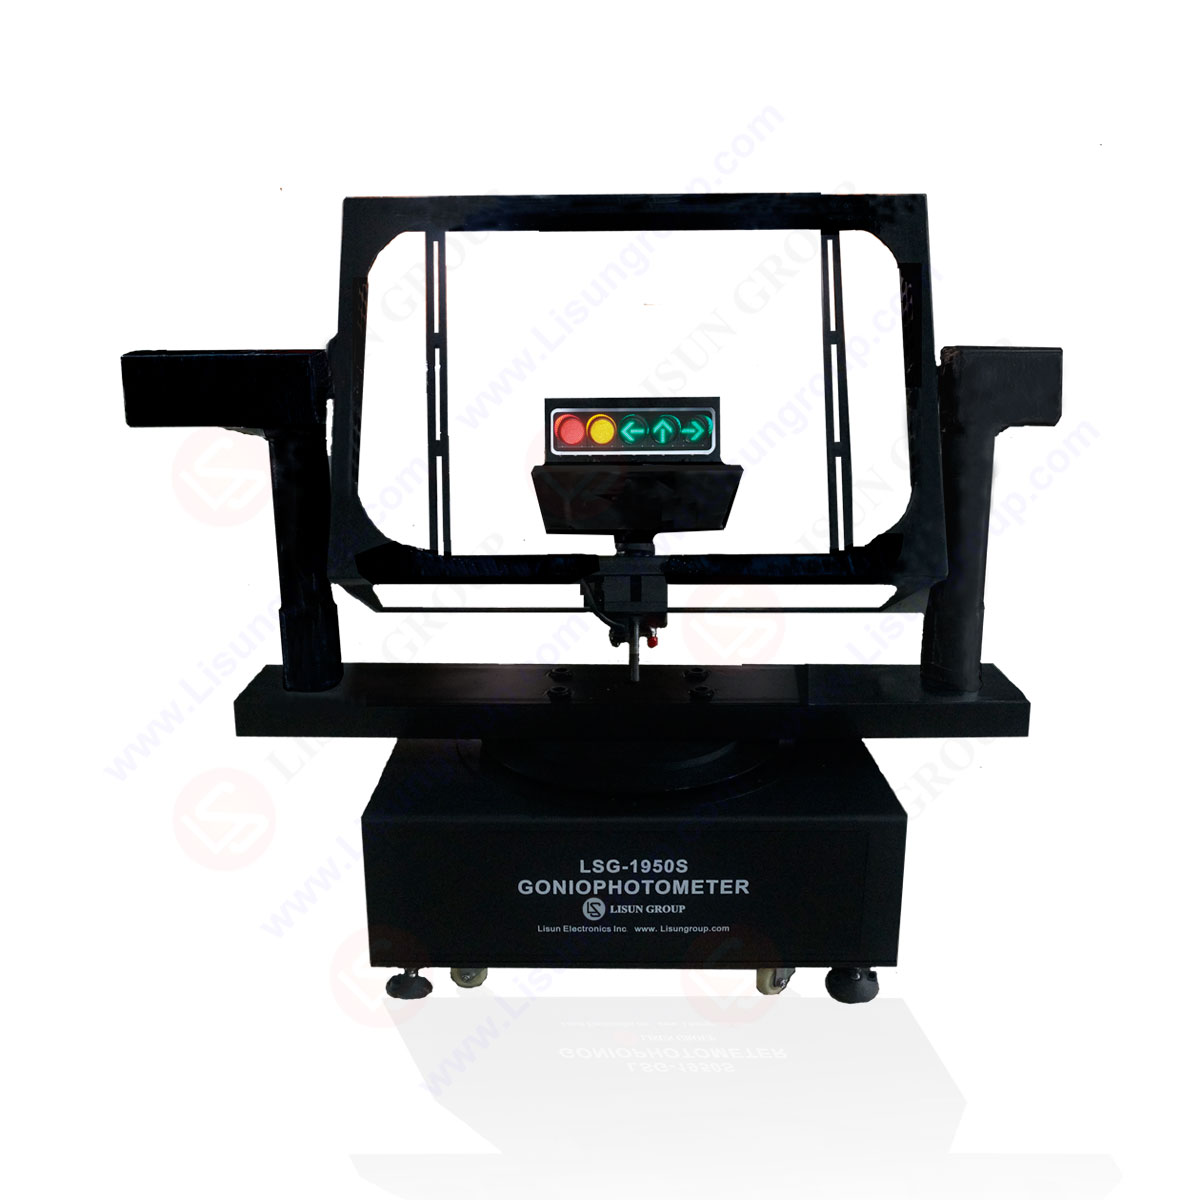
Goniophotometer for Traffic Signal Lamps
LSG-1950S
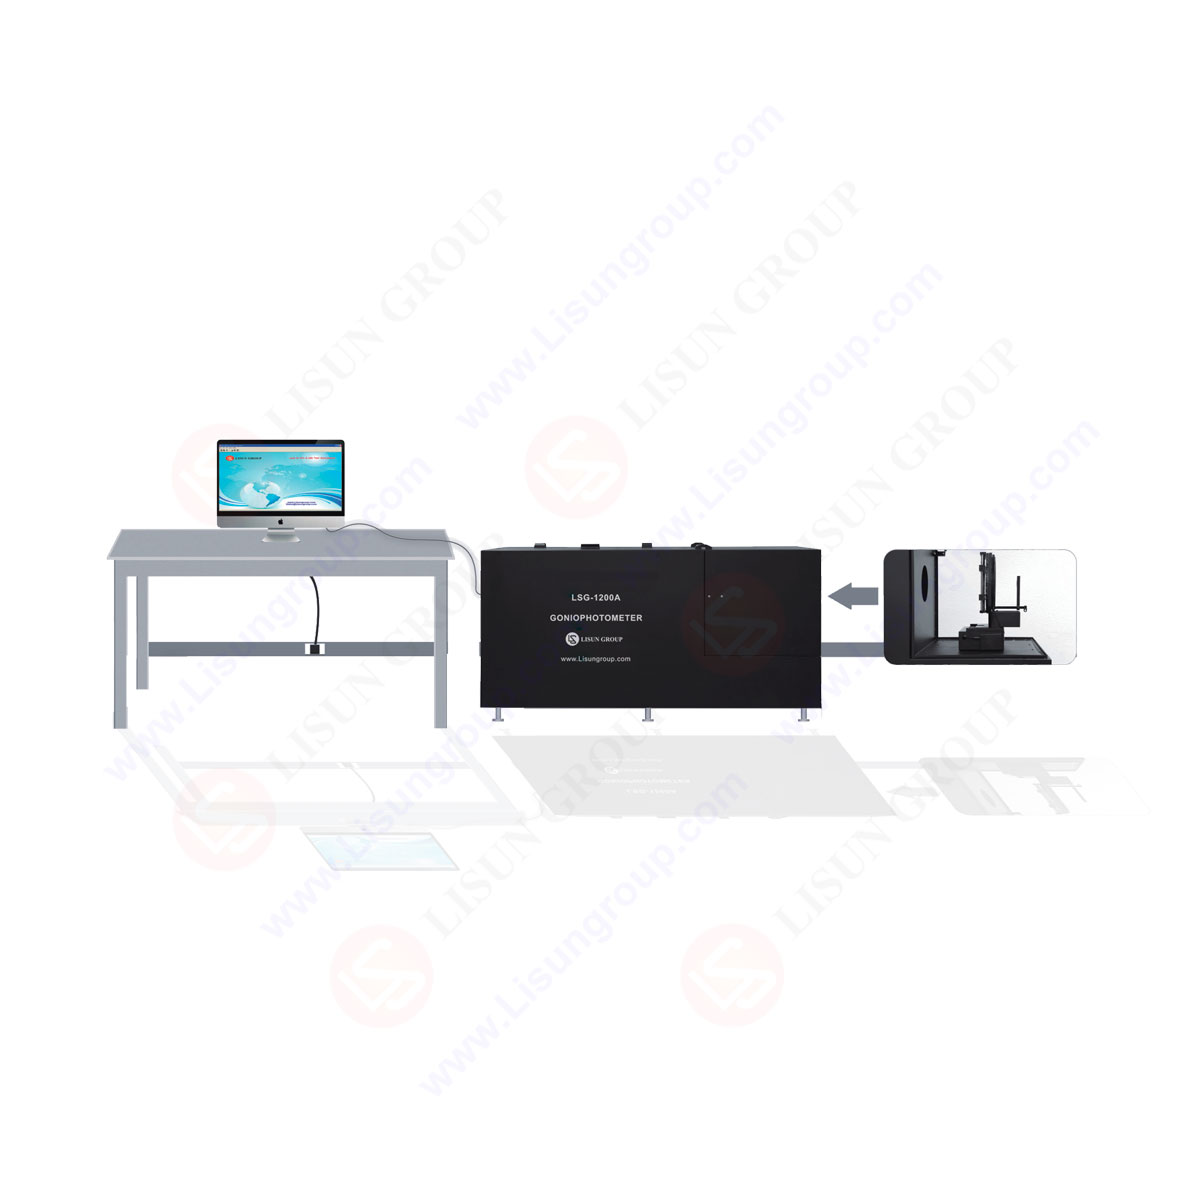
Compact Goniophotometer
LSG-1200A

Near Field Moving Detector Goniophotometer
LSG-1900B
Select an organization
to browse standards
We know that CIE (International Commission on Illumination) is the most authoritative organization in the colorimeter industry. Basically, the chromaticity space and color difference calculation formula used by Colorimeter are all launched by CIE.
The CIE Lab, CIE RGB, and CIE XYZ that we are currently familiar with are all color difference instrument spaces launched and continuously improved by CIE. In fact, there are still some chromaticity spaces that we are not very familiar with, but also have applications in the color detection industry, such as CIE rg chromaticity maps. This chromaticity space is the predecessor of CIE XYZ. Let’s learn about this chromaticity chart together now.
The CIE rg chromaticity diagram is shown in the following figure. We plotted the contour curve of the rg chromaticity diagram based on the previously measured data. In the spectral trajectory of a partial horseshoe shape, a significant portion of the chromaticity coordinate r is negative. This system specifies equal energy white light (E-light source, color temperature 5500K), located at the center of the chromaticity map (0.33, 0.33).
In the CIE rg chromaticity map, the chromaticity coordinates reflect the relative proportions of the three primary colors in the total tristimulus values. A set of chromaticity coordinates represents the common characteristics of colors with the same hue and saturation but different brightness. Therefore, the CIE rg chromaticity map does not reflect changes in color brightness, and the outline of the chromaticity map represents the color gamut range of the color.
The r of the 1931 CIE-RGB system( λ)、 g( λ)、 b( λ) Spectral tristimulus values are obtained from experiments and could have been used for color measurement and calibration as well as colorimetry calculation. However, the primary colors obtained from the experimental results used to calibrate spectral colors appear negative values, which are inconvenient to understand. Therefore, in 1931, CIE recommended a new international colorimetry system – the 1931CIE-XYZ system, also known as the XYZ international coordinate system.

XYZ international coordinates
The biggest purpose of CIE rg chromaticity chart is to understand the predecessor of the currently used chromaticity chart 1931CIE XYZ system. It is precisely because the positive and negative alternation of CEI rg chromaticity space is very inconvenient, and it is not suitable to understand colorimetry that the more uniform and perfect 1931CIE XYZ will be launched.
Precautions during the use of colorimeter:
1. A customer provides a set of color coordinates to the manufacturer without providing a standard sample. In this case, it is important to clarify in which color space the color coordinates provided by the customer are measured, as well as the lighting conditions and type of light source. The measured values vary greatly in different color coordinate spaces and are not comparable;
Under the same color space, different lighting conditions result in significant differences in chromatic coordinates, but the color difference is relatively small. In this situation, customers need to provide standard samples, use standard samples to communicate with users, use standard samples as benchmarks, and control color differences;
2. It is necessary to determine the color coordinate space of the current instrument based on the user’s color coordinate space. All instruments are adjusted using a standard whiteboard as a benchmark. After the instrument is used for a period of time, it is necessary to recalibrate the instrument with a random standard whiteboard to achieve the highest measurement accuracy;
3. The difference between the two measurement results is significant
A. Dirt entering the measuring port can cause inaccurate measurement and seriously affect the measurement results;
B. Check if the battery consumption is too low (below 20%), replace it with a new dry battery or use a DC power supply.
C. Check whether the instruments and test items are stable during measurement, and whether the contact between the measuring port and the measuring surface is tight and good;
D. Check if the measured object is too thin and leaks light
E. Check if the measurement area is mixed in color
Portable Colorimeter/Chroma Meter is an innovation color measuring tool with powerful configuration to make color measurement easier and more professional; It support Bluetooth to connect with Android and ISO devices, Portable Colorimeter/Chroma Meter will take you into a new world of color management; It can be widely used to measure color value, color difference value and find similar color from color cards for printing industry, paint industry, textile industry, etc.

CD-320PRO_Portable Colorimeter/Chroma Meter
Lisun Instruments Limited was found by LISUN GROUP in 2003. LISUN quality system has been strictly certified by ISO9001:2015. As a CIE Membership, LISUN products are designed based on CIE, IEC and other international or national standards. All products passed CE certificate and authenticated by the third party lab.
Our main products are Goniophotometer, Integrating Sphere, Spectroradiometer, Surge Generator, ESD Simulator Guns, EMI Receiver, EMC Test Equipment, Electrical Safety Tester, Environmental Chamber, Temperature Chamber, Climate Chamber, Thermal Chamber, Salt Spray Test, Dust Test Chamber, Waterproof Test, RoHS Test (EDXRF), Glow Wire Test and Needle Flame Test.
Please feel free to contact us if you need any support.
Tech Dep: Service@Lisungroup.com, Cell/WhatsApp:+8615317907381
Sales Dep: Sales@Lisungroup.com, Cell/WhatsApp:+8618117273997
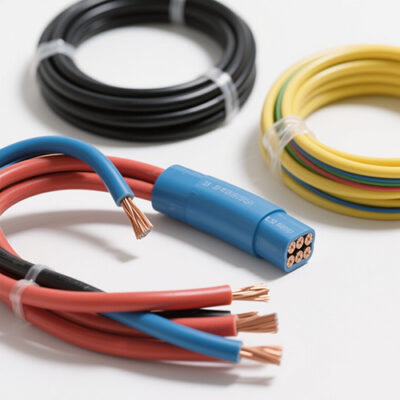
LISUN’s cable and wire test solutions meet IEC 60245-1, IEC 60227-1, IEC 60502-1 and IEC 60189 standards, covering electrical, mechanical, and safety tests for global compliance.
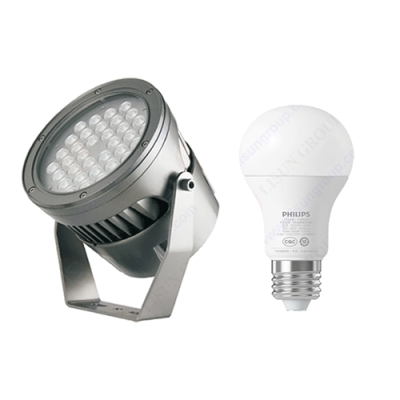
LISUN’s indoor and outdoor LED test solutions meet IEC 60598-1, IEC 62722-2-1, CIE 121 standards, covering safety, photometry, and environmental tests for global compliance.

 中文简体
中文简体