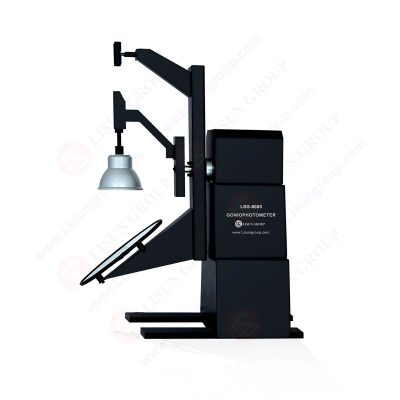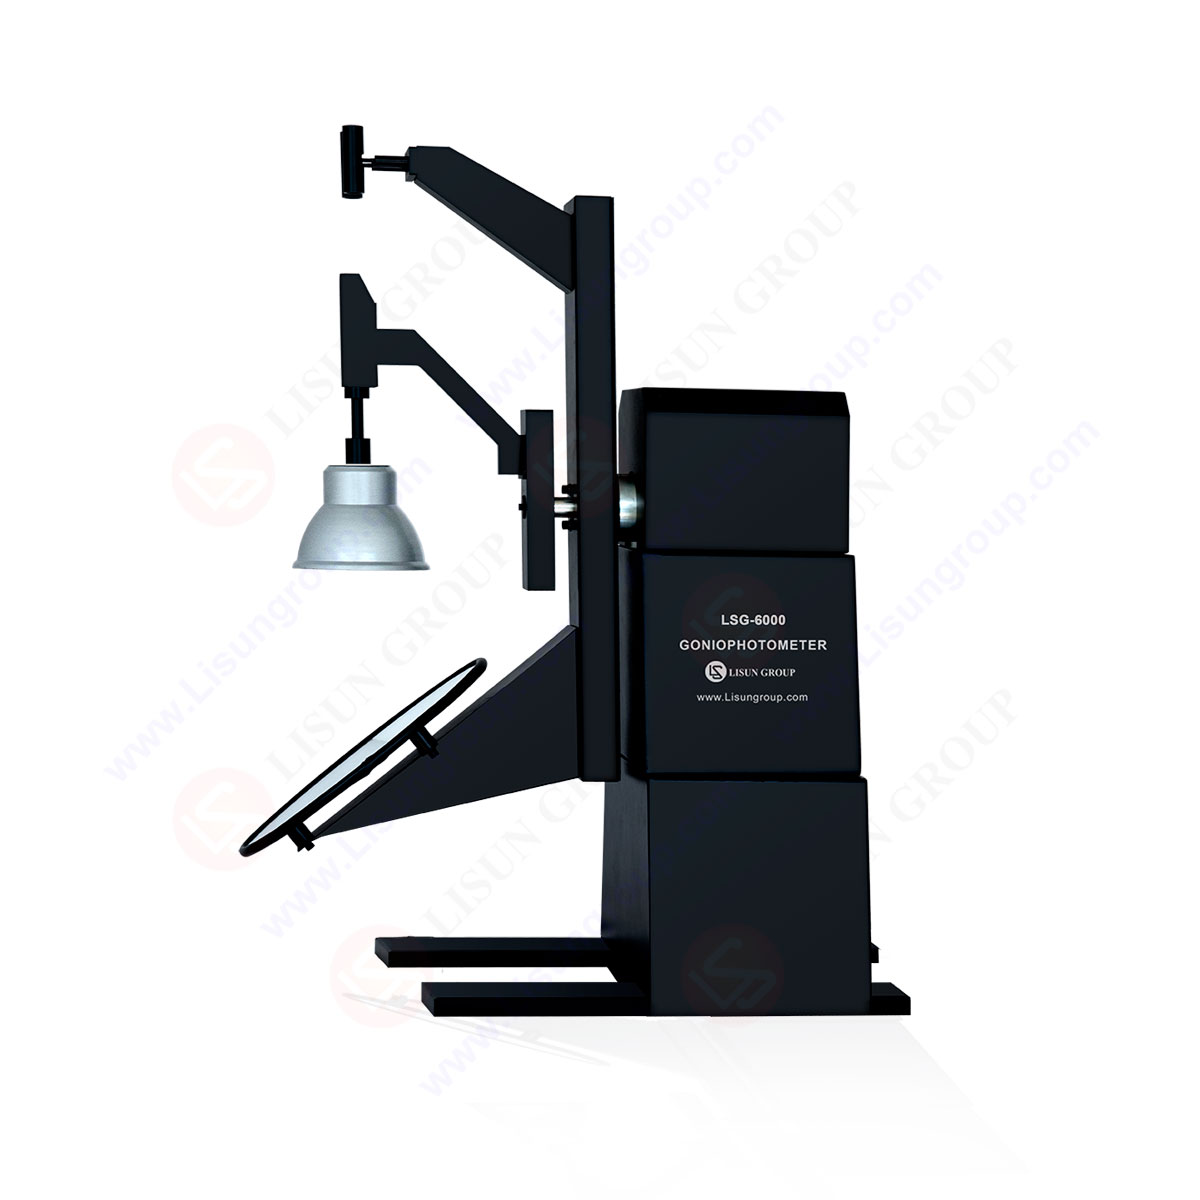
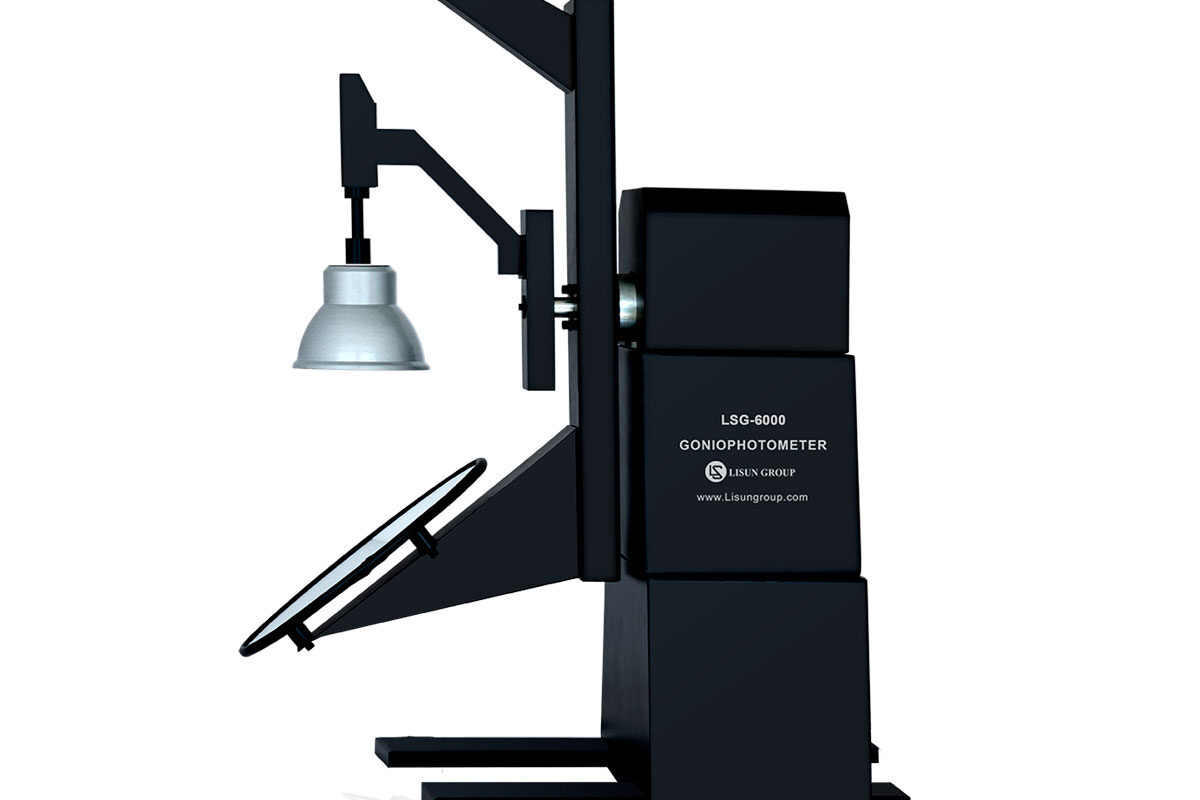
LM-79 Moving Detector Goniophotometer (Mirror Type C)
LSG-6000
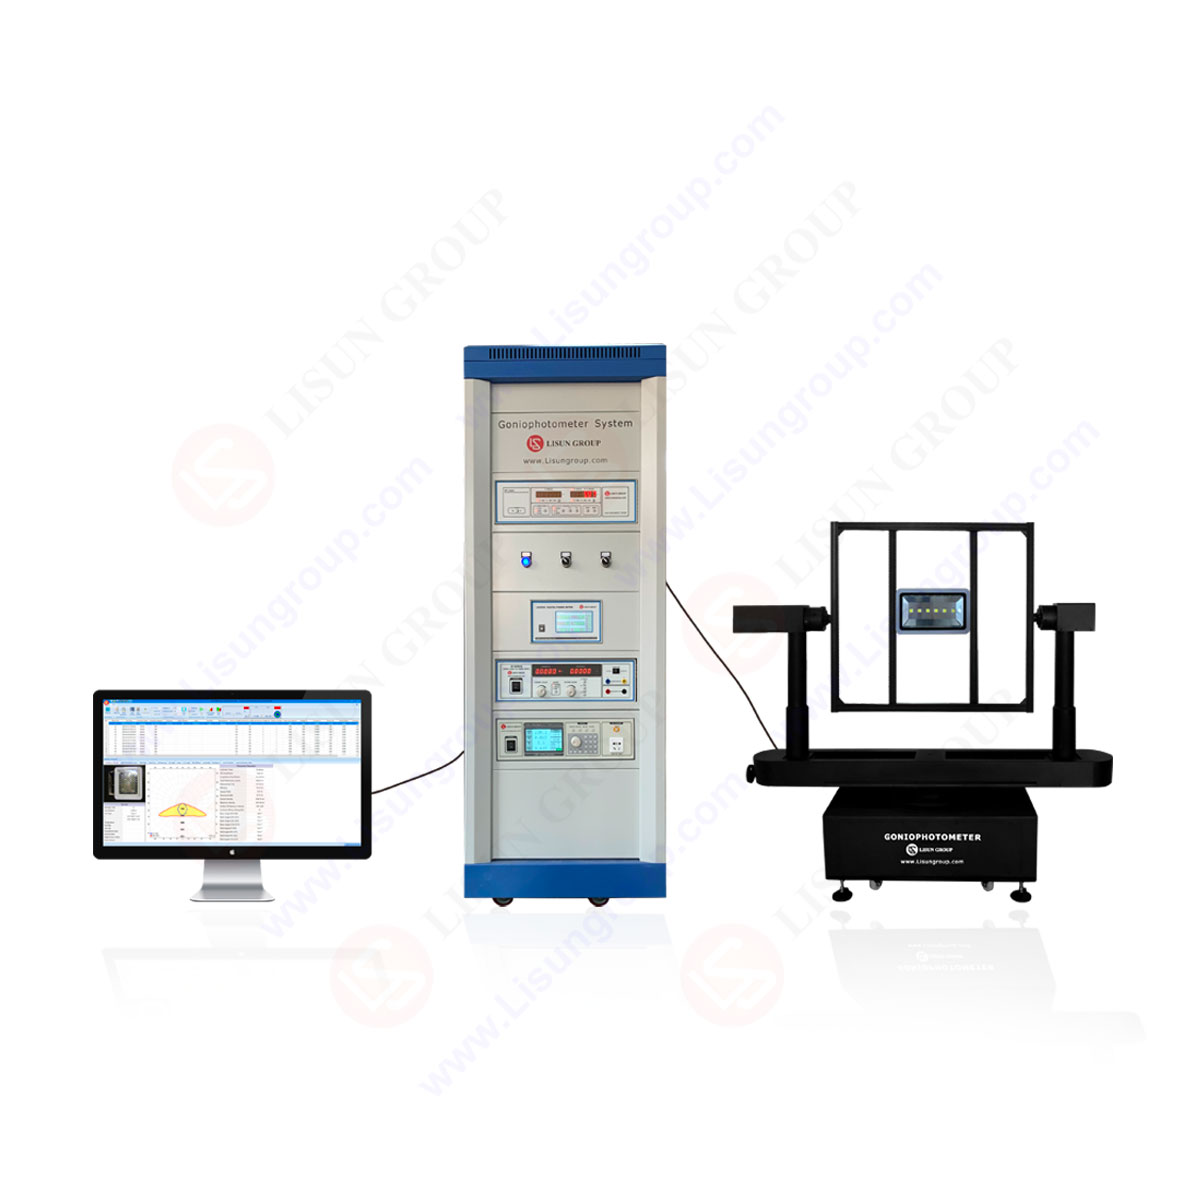
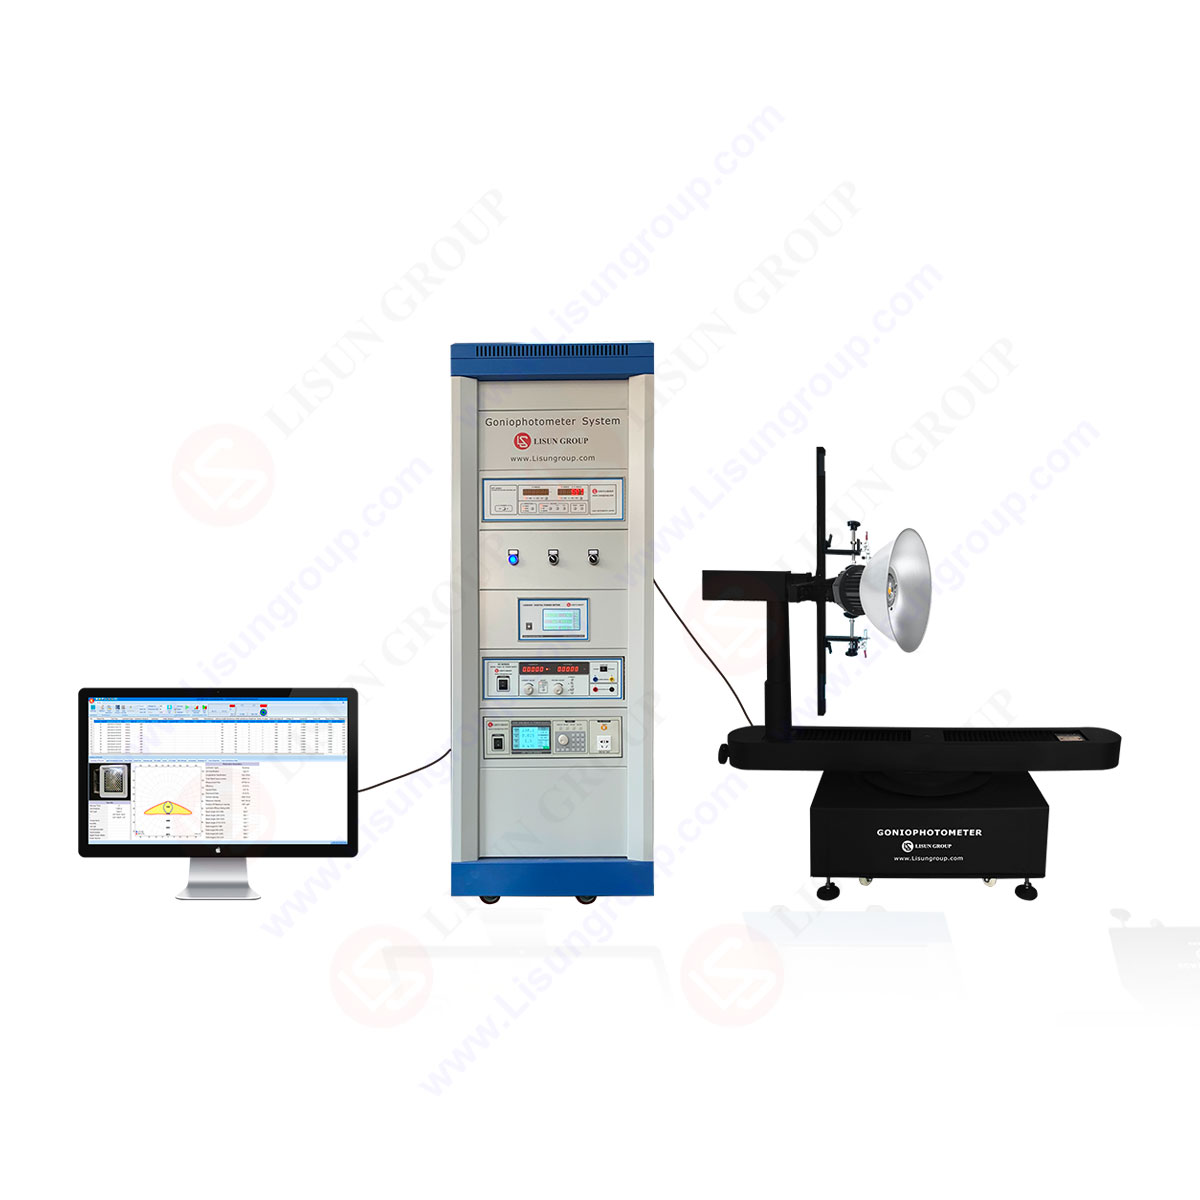
High Precision Rotation Luminaire Goniophotometer
LSG-1890B
High Precision Rotation Luminaire Goniospectroradiometer
LSG-1890BCCD
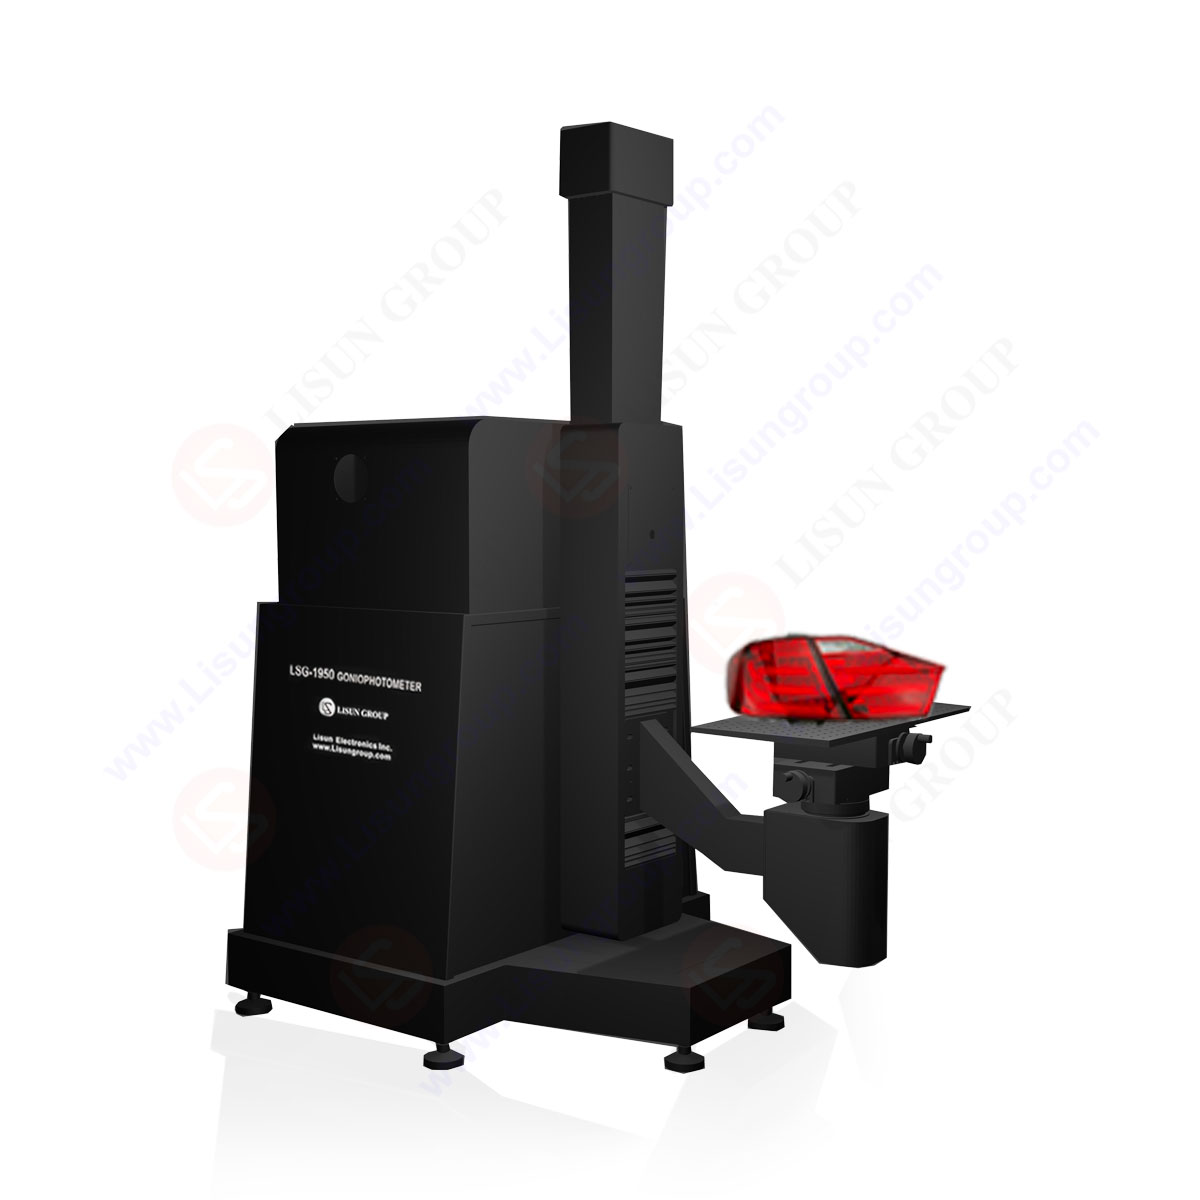
Goniophotometer for Automotive and Signal Lamps
LSG-1950
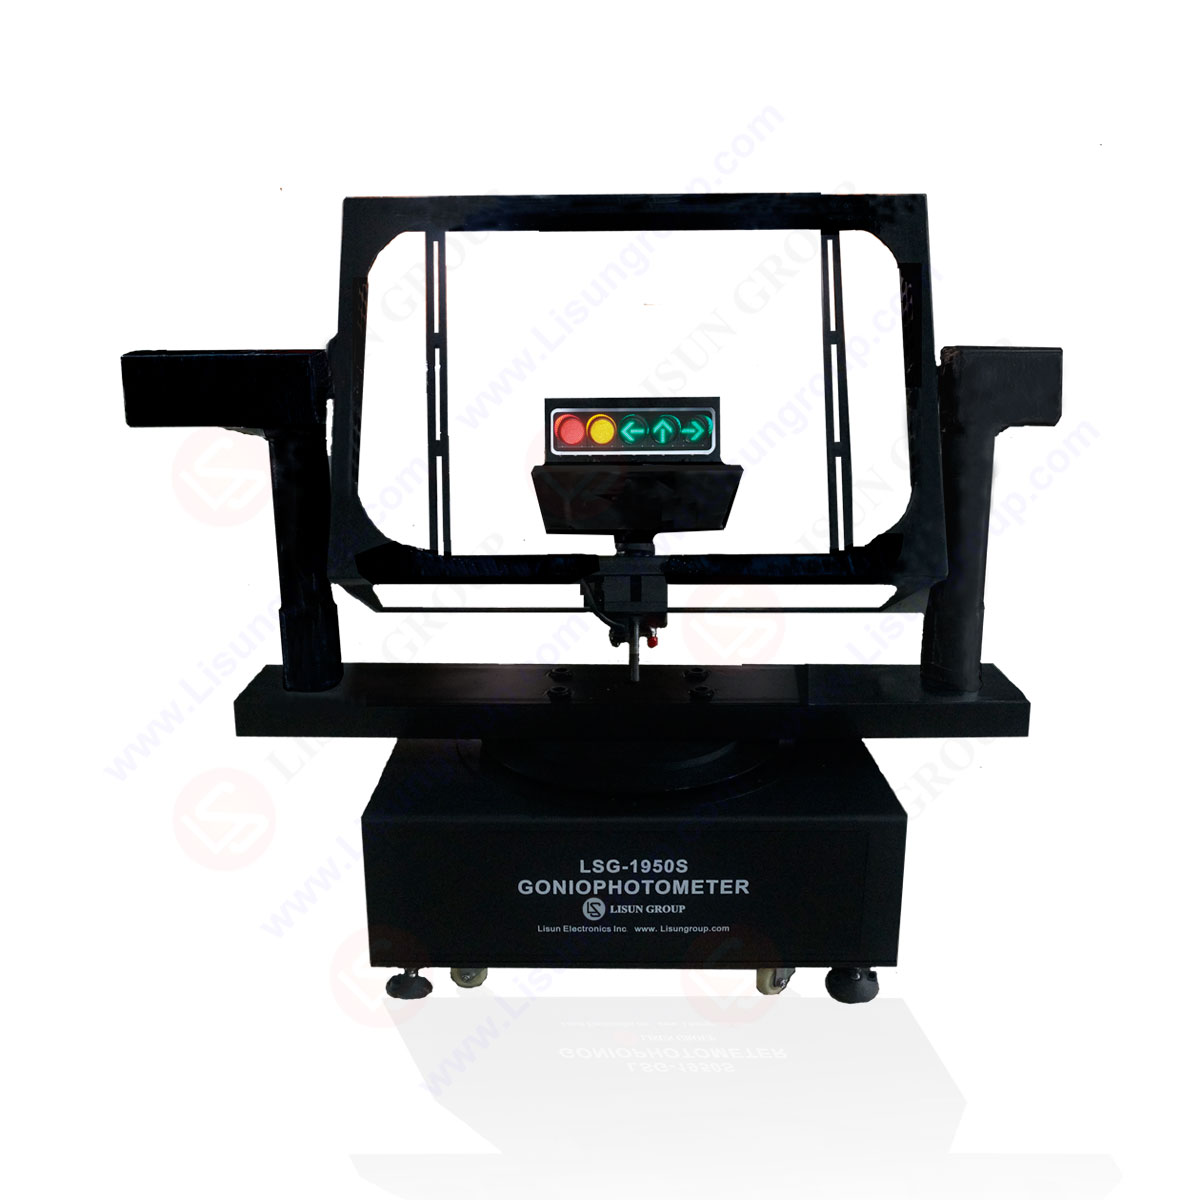
Goniophotometer for Traffic Signal Lamps
LSG-1950S
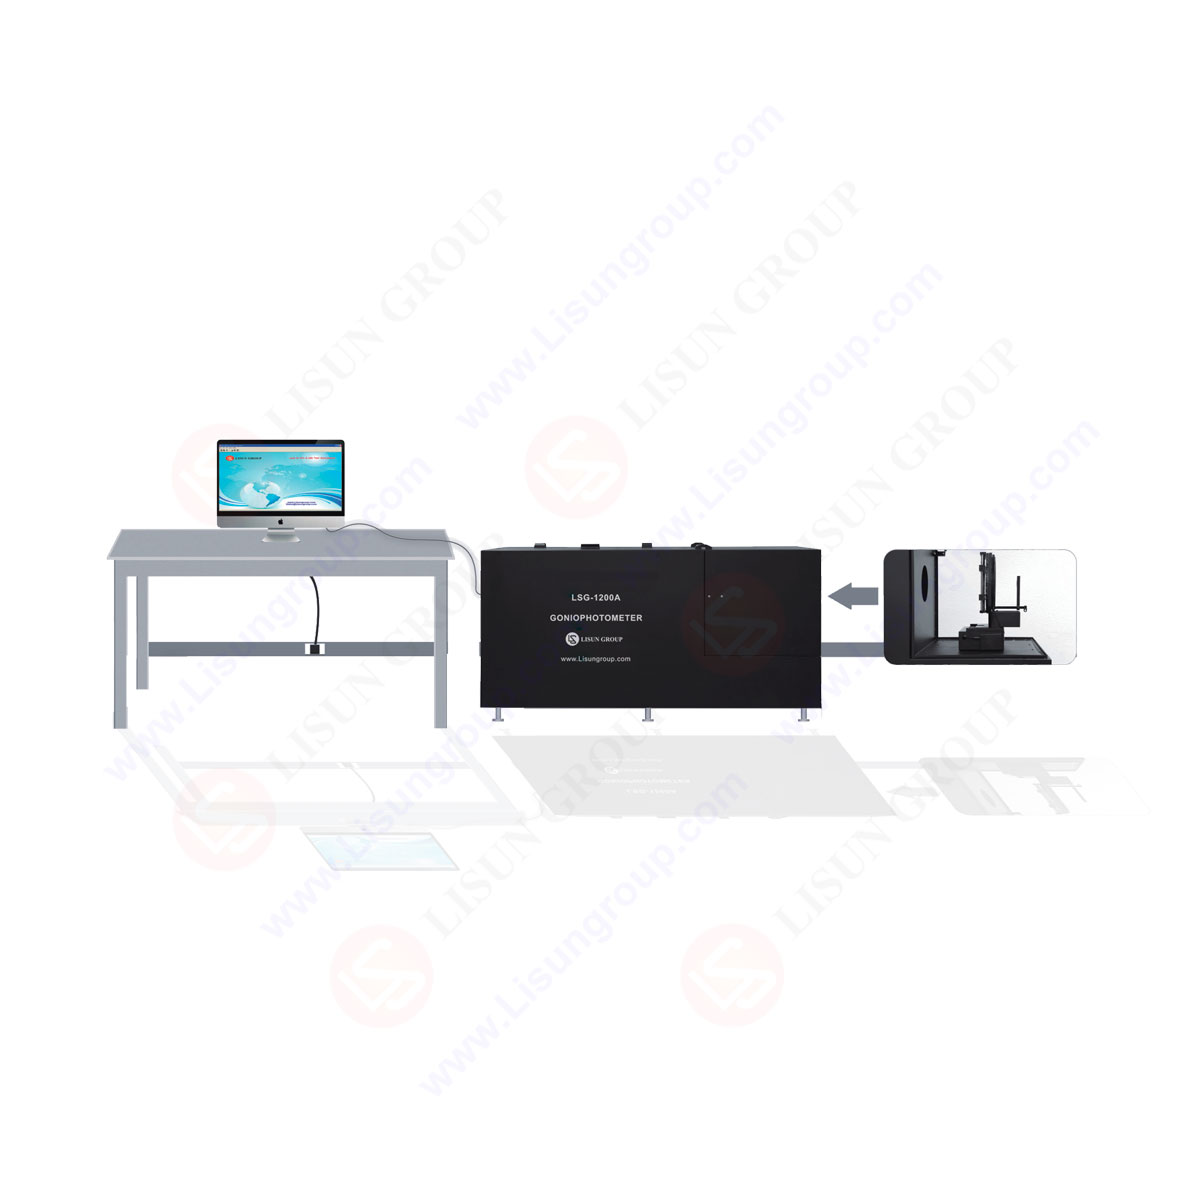
Compact Goniophotometer
LSG-1200A

Near Field Moving Detector Goniophotometer
LSG-1900B
Select an organization
to browse standards
Introduction
In order to accurately represent the geographical distribution of light coming from a variety of sources and fixtures, the field of lighting places a significant amount of emphasis on goniophotometry. It includes measuring the brightness of a scene from a variety of angles, which results in the generation of an enormous number of data that has to be processed and analysed in depth.
The process of analyzing and interpreting goniophotometric data is explored, as well as the key issues, approaches, and equipment utilized in the field of goniophotometry that are reviewed in this article.
By gaining an understanding of this analytical method and making use of goniophotometric data, lighting professionals have the potential to enhance lighting design, assess performance, and fulfill specific lighting requirements.
Understanding Goniophotometric Data
The directional properties of light output by a source or luminaire may be recorded by collecting goniophotometric data, which in general consists of measurements of luminous intensity at various viewing angles.
This kind of data collection can be done by a luminaire or a source. The transformation of raw data into a format that can be used is the first phase in any study. Visualizing the connection between light intensity and viewing angle could be easier if you create luminous intensity distribution curves (LIDCs) or convert the data to polar coordinates.
In order to properly evaluate goniophotometric data, it is essential to have a solid understanding of the measurement settings and parameters. It is essential to take into consideration the many aspects of the measurement setup, including the source-to-detector distance, angle resolution, and detectable spectrum.
As a consequence of these potentially confusing factors, the accuracy and reliability of the data may be negatively affected.
Interpretation Techniques and Tools
Effective interpretation of goniophotometric data requires the use of a number of methods and instruments. Some of them are:
Luminous Intensity Distribution Curves (LIDCs): Light intensity distribution charts, also known as LIDCs, are used to display how intense light is from a certain source or fixture from a variety of various angles. They may be used by designers in order to examine the directional qualities of the light, as well as the beam’s homogeneity and features. It is possible to choose the most appropriate lighting method for a certain job by analyzing the LIDCs produced by a variety of luminaires and sources.
Isocandela Diagrams: An illustration in two dimensions showing the distribution of light intensity along a plane or section; this kind of diagram is called an isocandela diagram. Because they provide a 360-degree vision, with their assistance, you will be able to examine beam spread, cutoff angles, as well as the presence of dark areas and hot spots.
Colorimetric Analysis: It is possible for goniophotometric data to include colorimetric information, which makes it possible to conduct research on color attributes and spatial color uniformity. It is possible to evaluate the color quality and uniformity of the light source by obtaining characteristics such as color rendering indices, color temperatures, and chromaticity coordinates from the data. These parameters may be used to evaluate the light source.
Statistical Analysis: Statistical techniques such as data clustering, regression analysis, and hypothesis testing are a few examples of the kinds of things that may be done using goniophotometric data in order to get actionable insights. With the use of these methodologies, patterns, trends, and correlations hidden within the dataset may be uncovered.
Simulation and Modeling: It is possible to simulate and model goniophotometric data by making use of a wide range of computational methodologies and software programs. Utilizing these tools makes it feasible to do tasks like as predicting the performance of a lighting system, improving the design parameters, and analyzing the influence that different factors have on the distribution of light.
Considerations in Data Interpretation
Several things must be kept in mind when interpreting goniophotometric data:
Measurement Accuracy: Validation of the quality and consistency of the goniophotometric measurements is a critical step. Considerations for data validity include issues like equipment calibration, measurement uncertainties, and environmental variables. You can select LISUN for the best goniophotometers.
Data Normalization: When comparing goniophotometric measurements recorded with different sources or luminaires, data normalization is a technique that is used often in order to account for changes in the absolute light intensity levels. It is possible to utilize normalizing procedures in order to generate a standard in order to facilitate meaningful comparisons.
Application Requirements: The specific requirements of the lighting application should serve as the guiding principle for the interpretation of the goniophotometric data. The application may have specific criteria for the light’s dispersion, beam angle, homogeneity, and perhaps other aspects of its characteristics. It is very necessary to have a solid understanding of these conditions in order to be in a position to make intelligent decisions when doing analysis.
Standards and Guidelines: When attempting to make sense of goniophotometric data, using known lighting standards and guidelines might prove to be beneficial. The usage of papers such as IES LM-79 and CIE S 025 makes it possible to standardize measurement techniques, as well as the display of results and the evaluation of performance.
Visual Comfort and Glare Evaluation: Data obtained from goniophotometry may be used to assess problems with visual comfort and glare. We may use this information to construct metrics such as the Unified Glare Rating (UGR), which evaluates the level of discomfort caused by various luminaires under a variety of illumination circumstances.
Optimization and Design Iteration: Analyzing goniophotometric data is a very helpful step in the process of iteratively improving the design and carrying out optimizations. Lighting professionals are required to examine the data, identify areas that may need improvement, and simulate a variety of different design scenarios in order to achieve the desired light distribution and performance.
Conclusion
In order to have a complete understanding of lighting systems and to be able to improve them, it is required to evaluate and interpret goniophotometric data. LIDCs, isocandela diagrams, colorimetric analysis, and statistical analysis are some of the tools that lighting specialists use to better understand the directional qualities, uniformity, and color characteristics of light sources and luminaires.
These techniques allow for a better understanding of the directional attributes, uniformity, and color characteristics of light sources and luminaires. The accuracy of the measurements, the requirements of the application, and the conformity to the rules and norms all play a role in ensuring the reliability and consistency of the conclusions of the analysis.
When lighting designers have a solid understanding of the fundamentals of goniophotometric data analysis, they are better able to fulfill the requirements of a wide variety of lighting applications and make informed decisions.
Lisun Instruments Limited was found by LISUN GROUP in 2003. LISUN quality system has been strictly certified by ISO9001:2015. As a CIE Membership, LISUN products are designed based on CIE, IEC and other international or national standards. All products passed CE certificate and authenticated by the third party lab.
Our main products are Goniophotometer, Integrating Sphere, Spectroradiometer, Surge Generator, ESD Simulator Guns, EMI Receiver, EMC Test Equipment, Electrical Safety Tester, Environmental Chamber, Temperature Chamber, Climate Chamber, Thermal Chamber, Salt Spray Test, Dust Test Chamber, Waterproof Test, RoHS Test (EDXRF), Glow Wire Test and Needle Flame Test.
Please feel free to contact us if you need any support.
Tech Dep: Service@Lisungroup.com, Cell/WhatsApp:+8615317907381
Sales Dep: Sales@Lisungroup.com, Cell/WhatsApp:+8618117273997
LISUN’s indoor and outdoor LED test solutions meet IEC 60598-1, IEC 62722-2-1, CIE 121 standards, covering safety, photometry, and environmental tests for global compliance.

 中文简体
中文简体