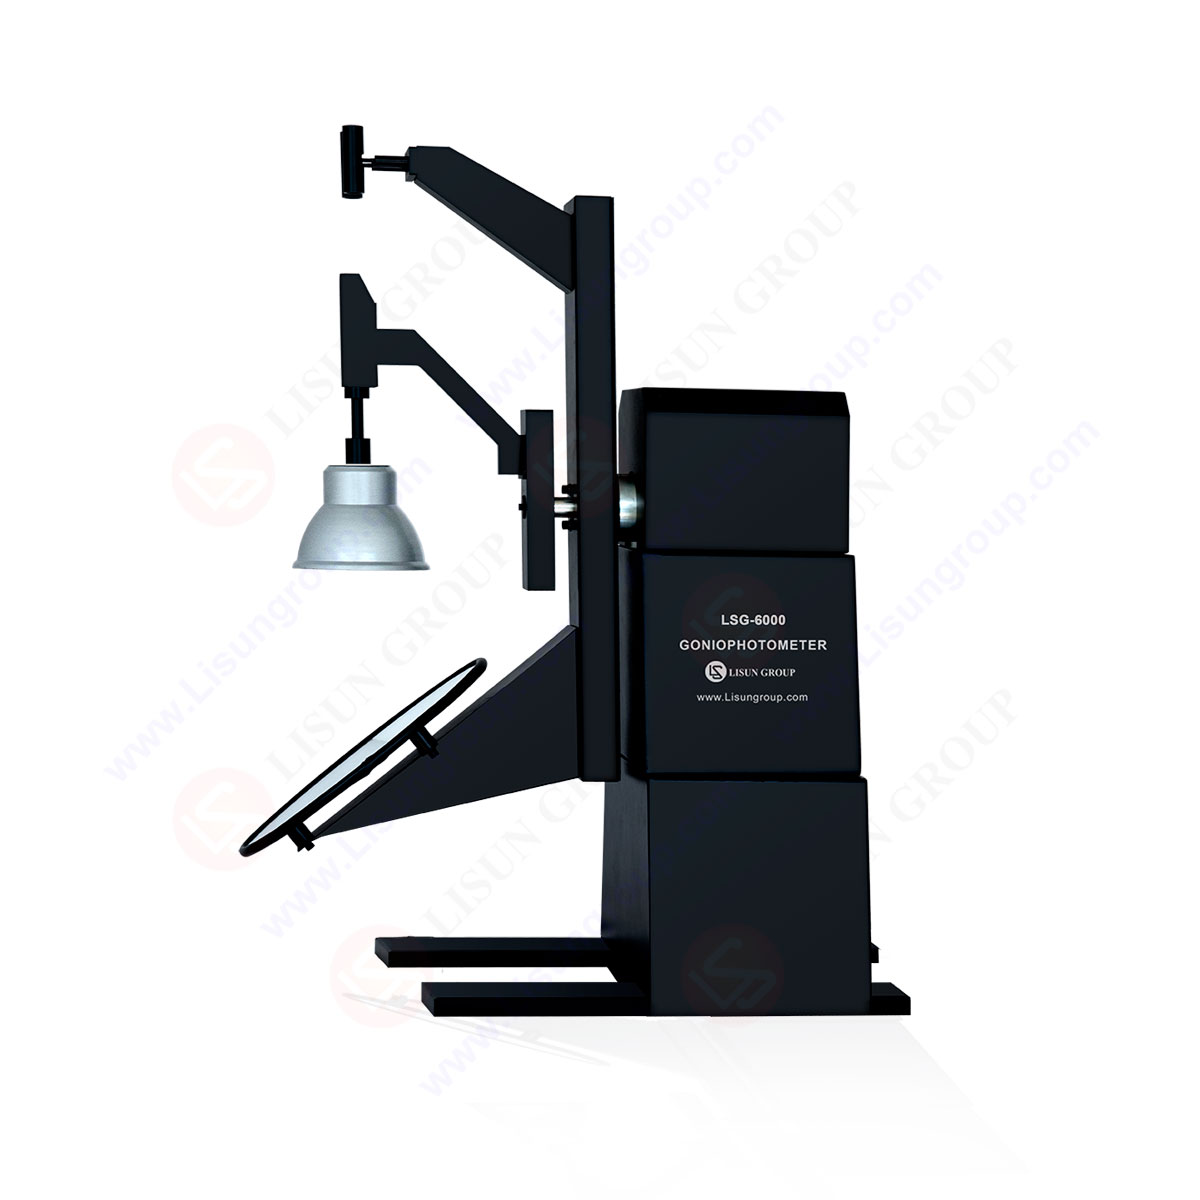
LM-79 Moving Detector Goniophotometer (Mirror Type C)
LSG-6000
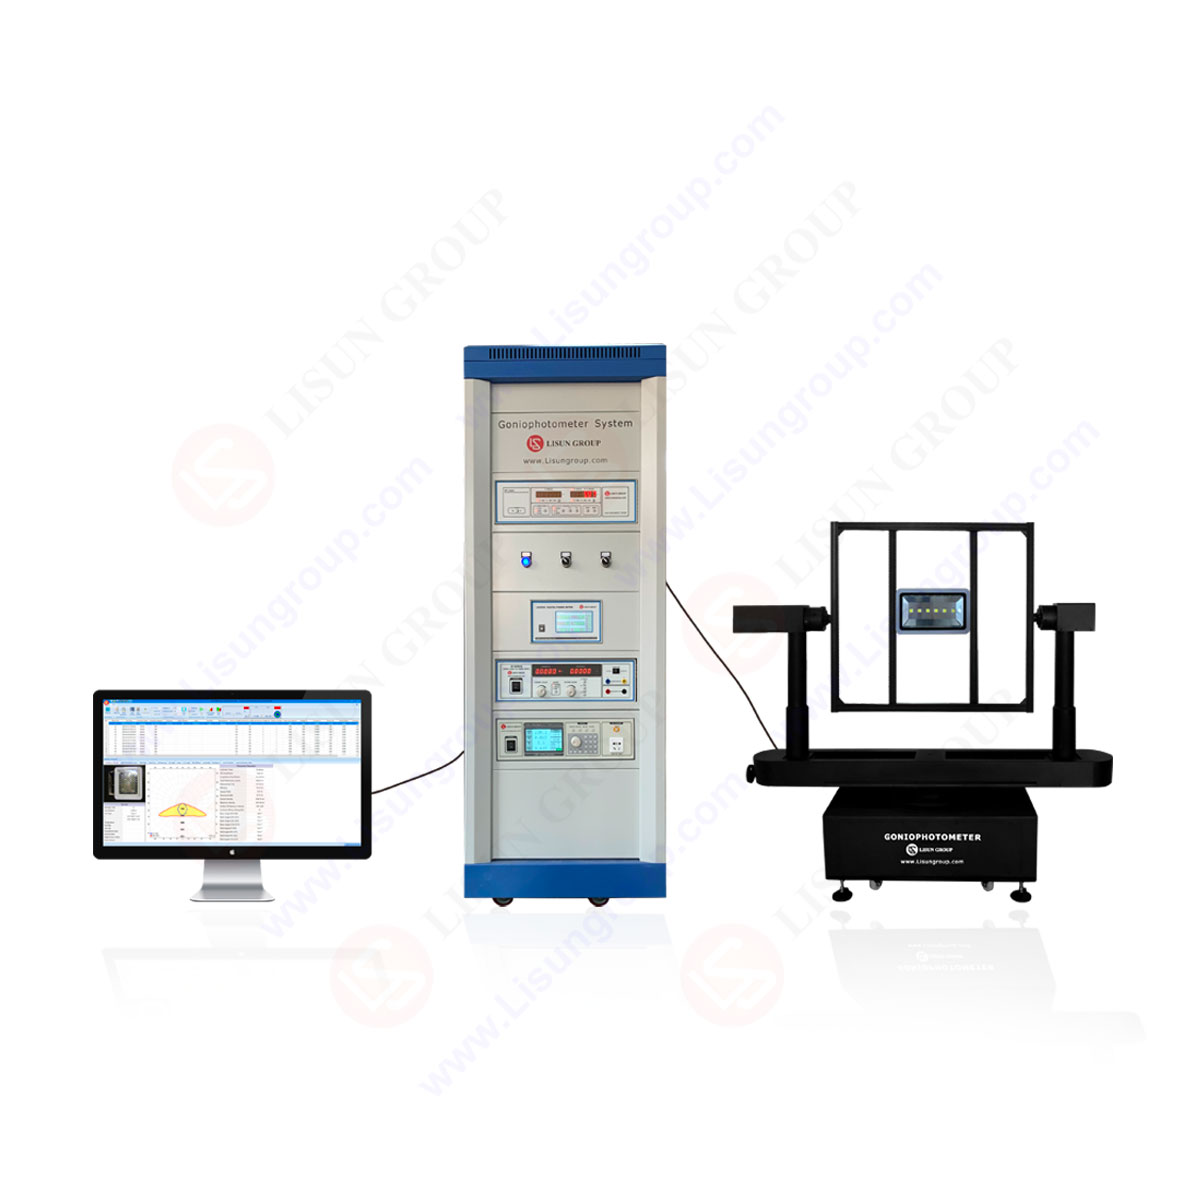
High Precision Rotation Luminaire Goniophotometer
LSG-1890B
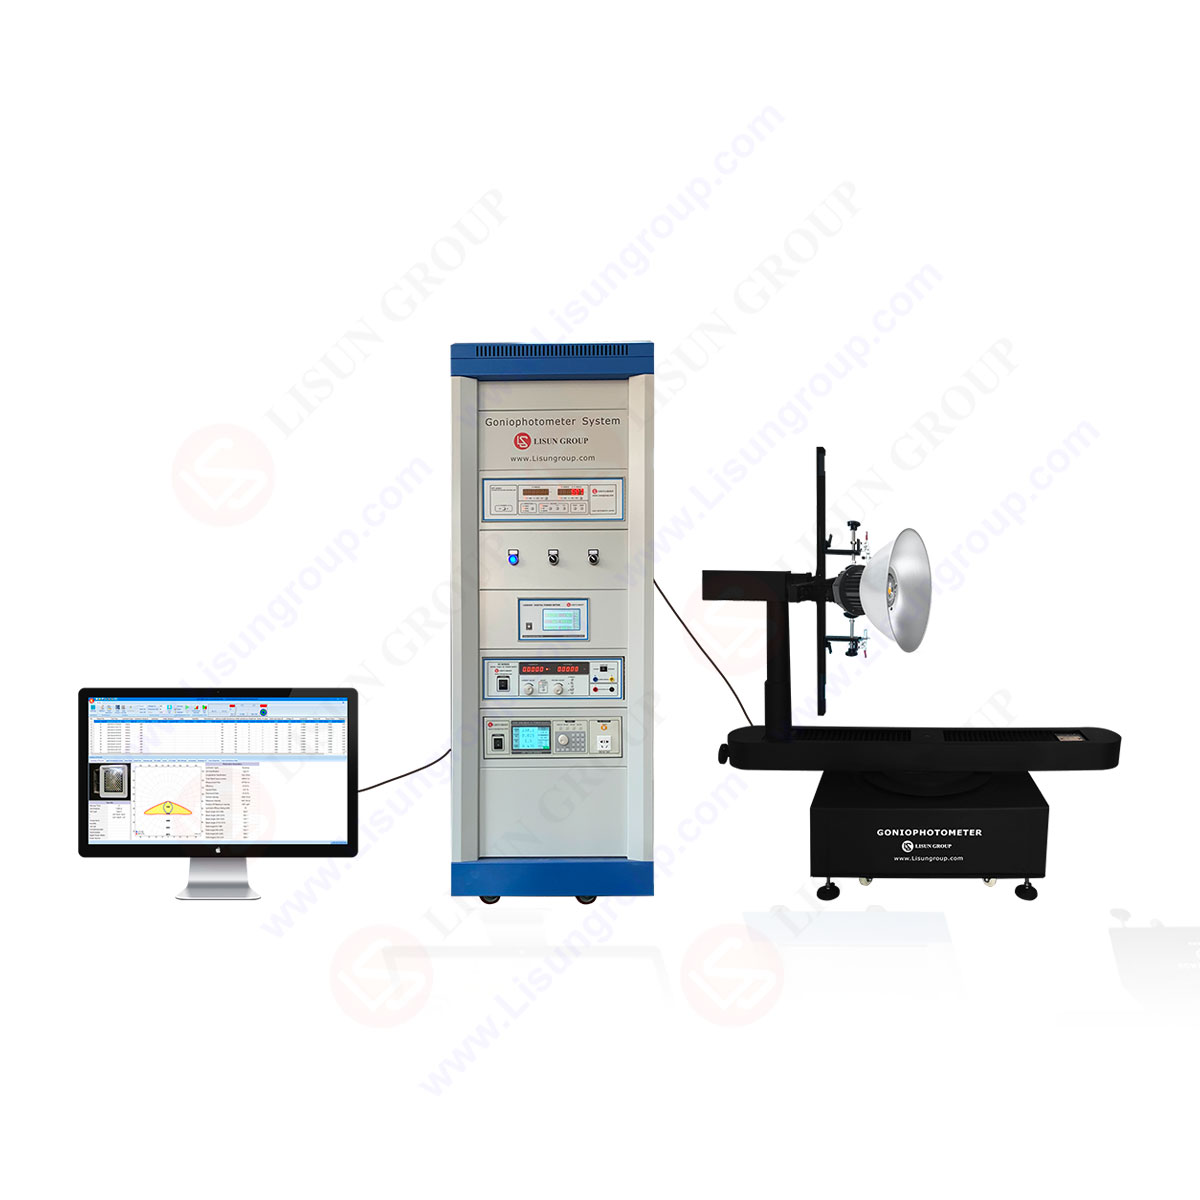
High Precision Rotation Luminaire Goniospectroradiometer
LSG-1890BCCD
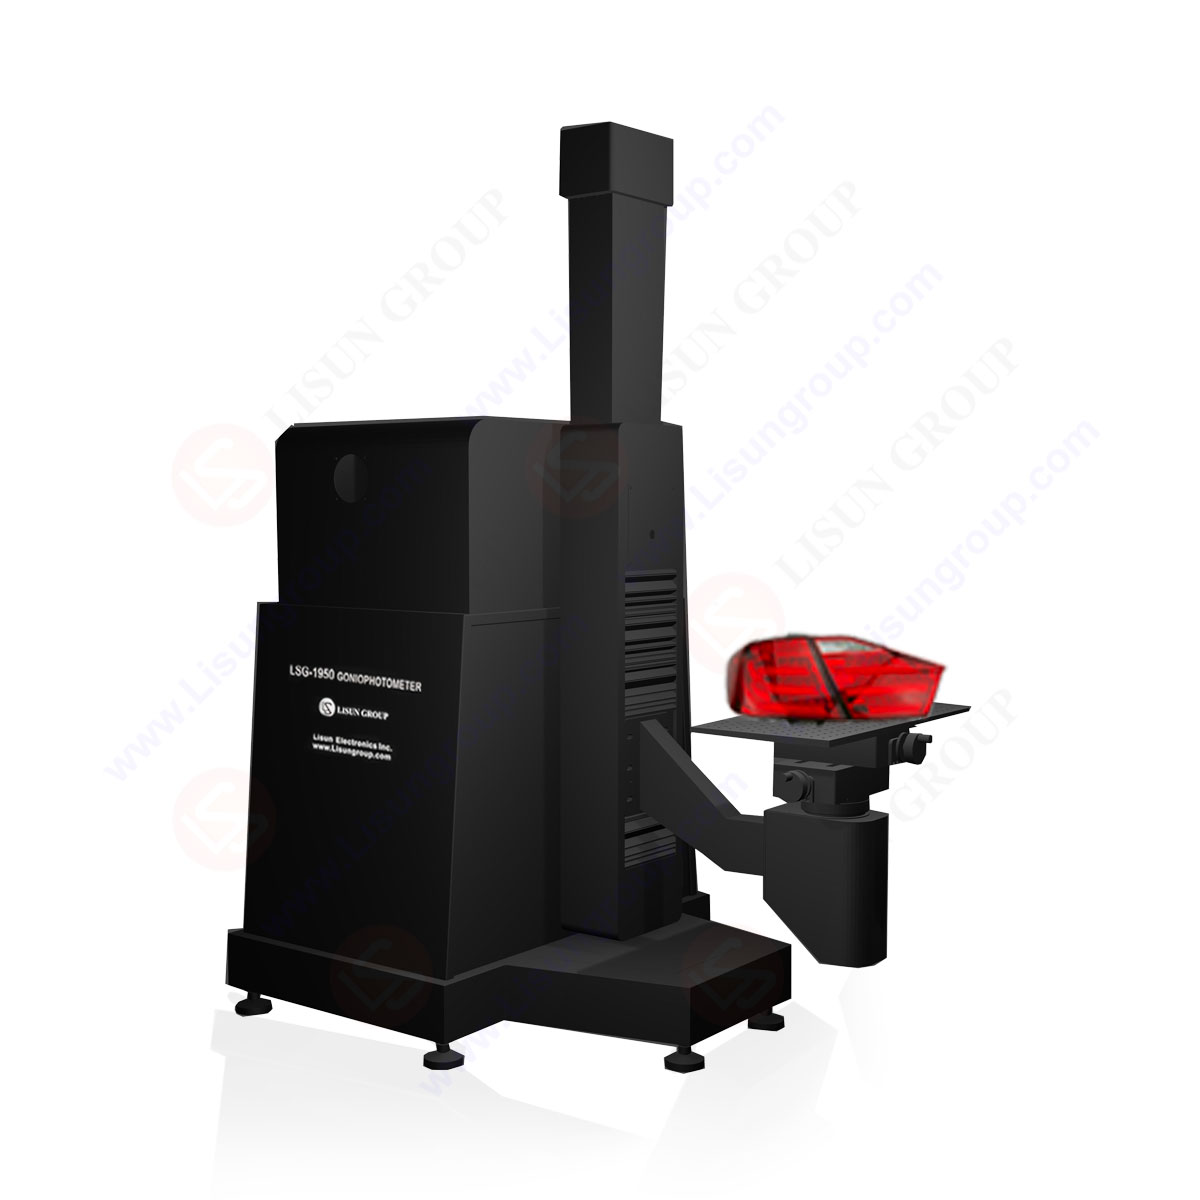
Goniophotometer for Automotive and Signal Lamps
LSG-1950
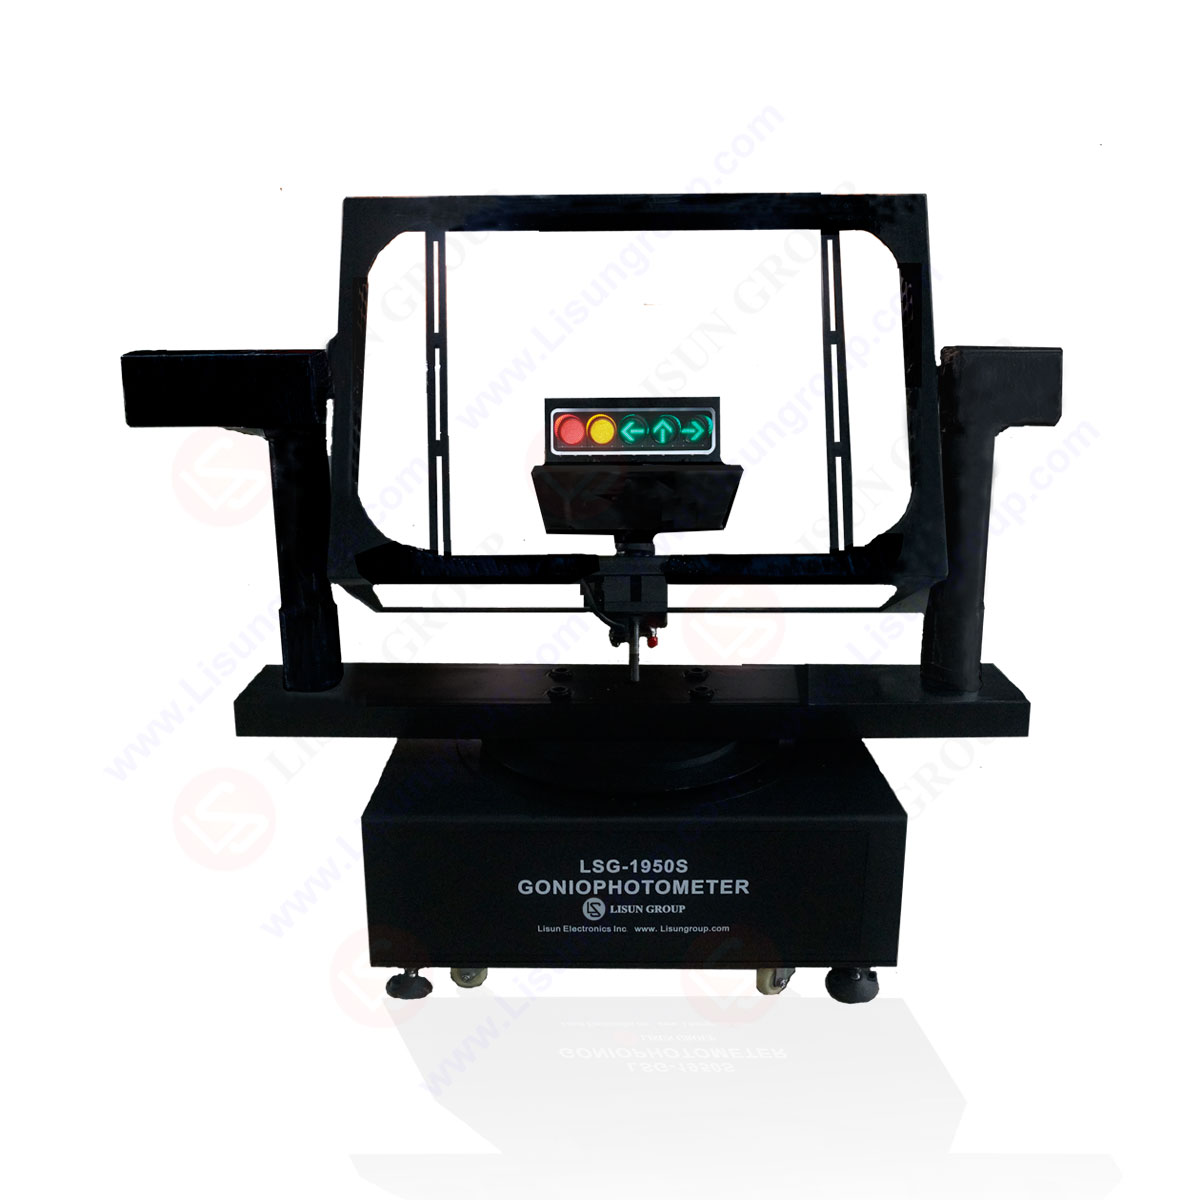
Goniophotometer for Traffic Signal Lamps
LSG-1950S
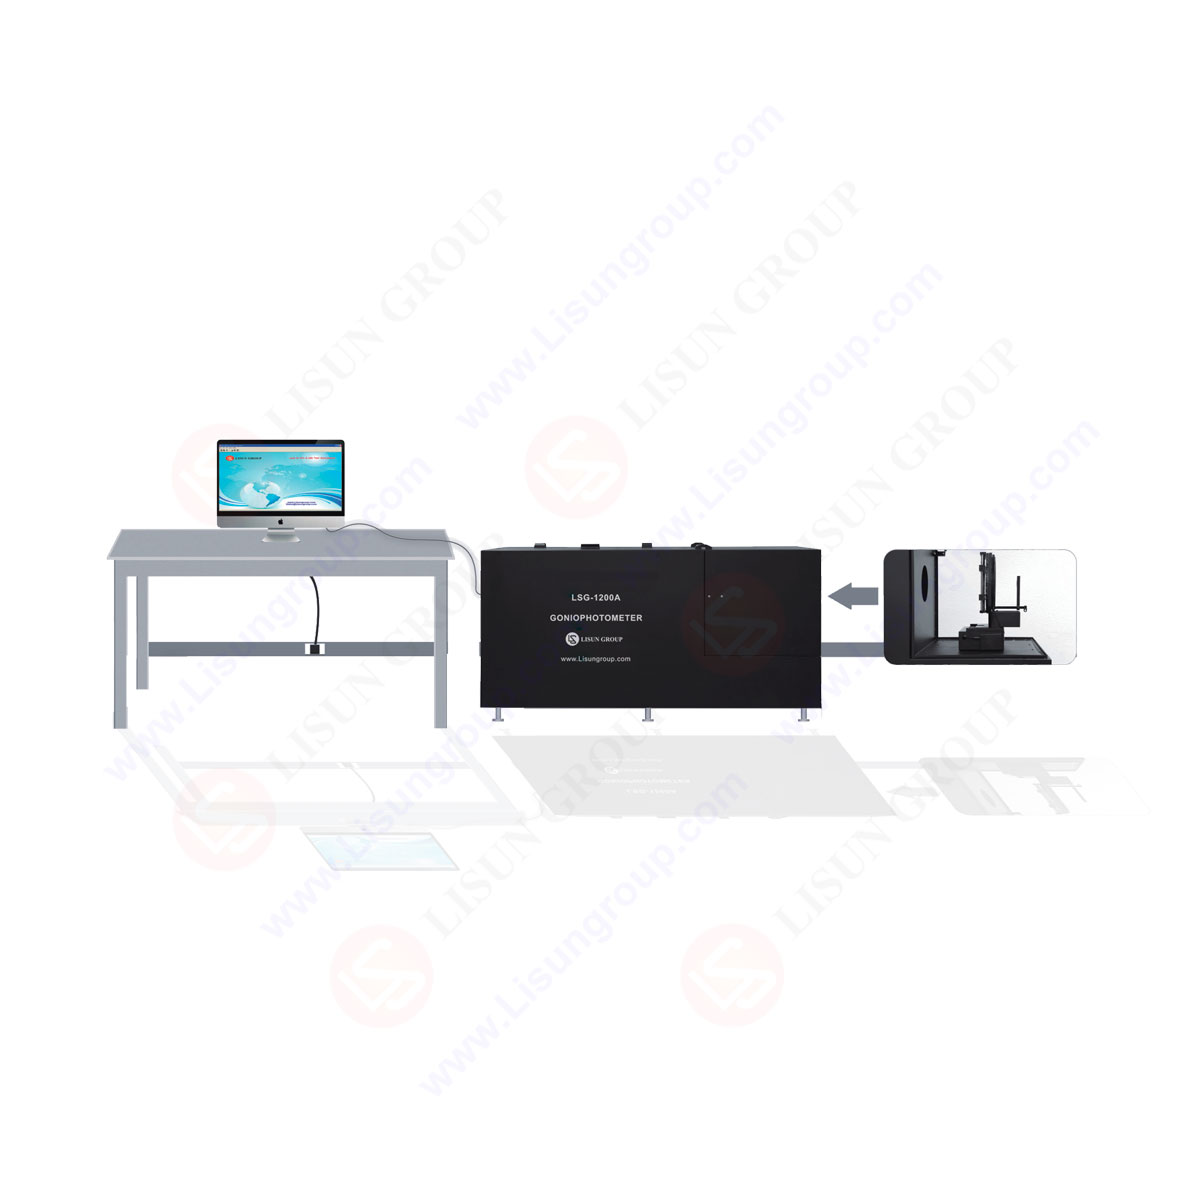
Compact Goniophotometer
LSG-1200A

Near Field Moving Detector Goniophotometer
LSG-1900B
Select an organization
to browse standards
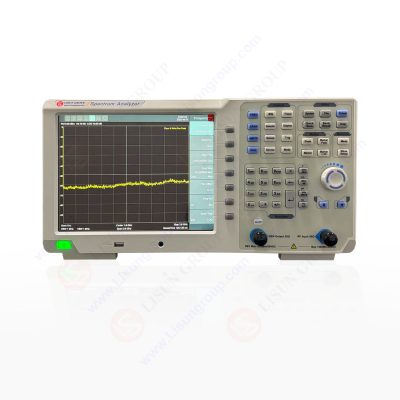
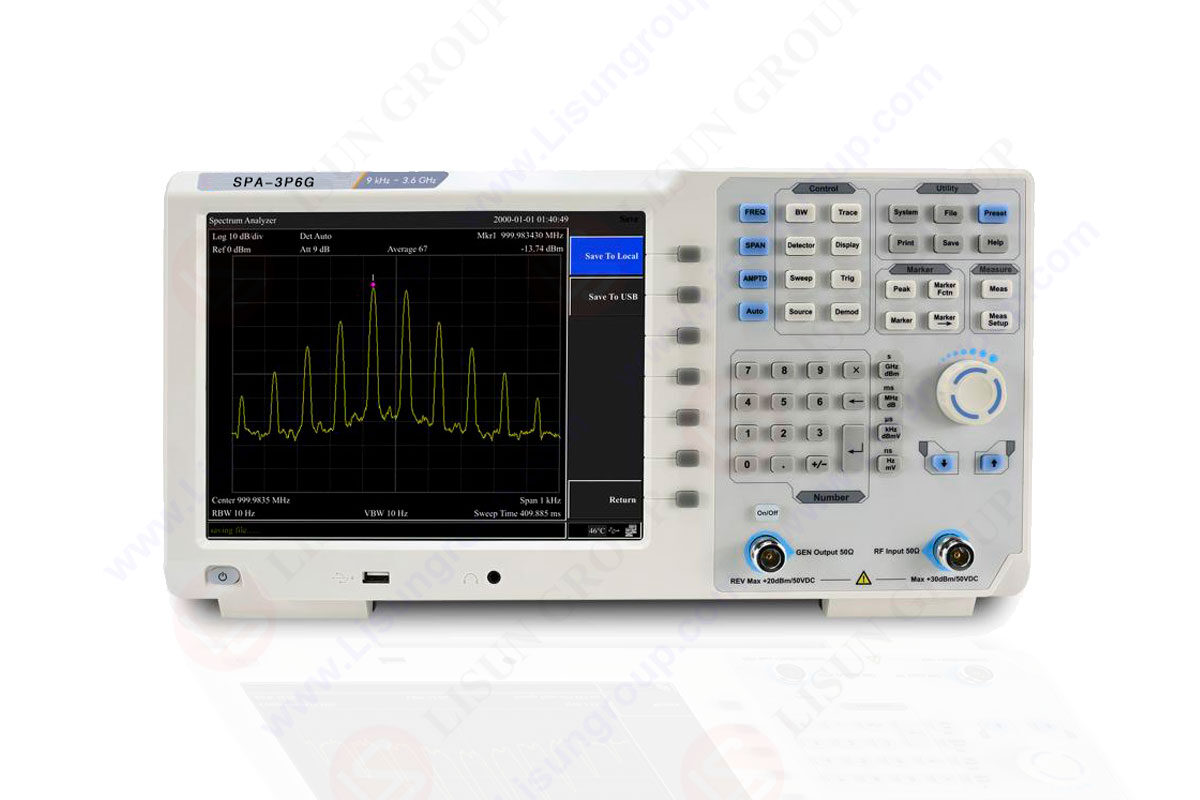
In its most basic form, a spectrum analyzer is a testing tool that evaluates a variety of circuit or system characteristics in the radio frequency range. Standard testing equipment would evaluate the quantity by calculating its amplitude over a certain period. It is also called a frequency analyzer.
Voltmeters, for instance, use the time domain to measure voltage amplitude. We may thus expect a sinusoidal curve for alternating current voltage and a straight line for direct current voltage. On the other hand, Spectrum analyzers would evaluate the amount by plotting its amplitude against its frequency.
In this signal, the vertical axis indicates the amplitude, hence this is a plot. The horizontal axis in a frequency domain representation shows frequency.
Thanks to the many model configurations available, it may use for various purposes in instrumentation and measurement. The dimensions, weights, and other features vary by application. Ultra-high frequency applications of the gadget are now the subject of study.
It may be linked to a computer to save readings to a digital system.
Spectrum Analyzer Working Principle
The basic function of a spectrum analyzer is to quantify the signal’s spectral content that is input to the device. A spectrum analyzer would use the frequency domain to measure the content of the filter’s output spectrum if we were analyzing a low-pass filter’s output.
It would also monitor the background noise level and provide that data to the CRO throughout this operation.
Essentially, the spectrum analyzer generates a vertical and horizontal sweep on the cathode ray oscilloscope, which it may use to classify its operation. When a signal is being measured, we know that the horizontal axis will correspond to the frequency, and the vertical axis will correspond to the amplitude.
The input attenuator is used to attenuate the signal’s radio frequency level to create the measured signal’s horizontal sweep. Attenuator output is routed into a low pass filter to smooth out the signal. Afterward, the signal is routed into an amplifier, which boosts its strength to the desired level.
It is combined with the frequency-tuned oscillator’s output at this point. To create a waveform with a periodic alternation, the oscillator is used.
After being amplified and combined with the oscillator, the signal is sent to the horizontal detector, which transforms it into the frequency domain. The spectrum analyzer provides a frequency-domain representation of the signal’s spectral quantity.
The amplitude is essential for vertical sweeping. The signal is sent into the voltage-tuned oscillator, which returns its amplitude. The radio-frequency tuning of the voltage-tuned oscillator. Oscillator circuits are typically constructed using a series of resistors and capacitors. It’s called an RC oscillator, or RC for short.
The signal undergoes a complete 180-degree phase shift at the oscillator level. Multi-stage RC circuits are employed to accomplish this phase shifting. The standard is three tiers.
In certain cases, transformers are also used to accomplish the task of phase shifting. Typically, a ramp generator is also used to regulate the oscillator frequency. In certain cases, a pulse width modulator is coupled with the ramp generator to produce a ramp of pulses.
The vertical sweep circuit receives the oscillator’s output, which gives the cathode ray oscilloscope its amplitude.

Figure: Spectrum analyzer
Why use a Spectrum Analyzer?
Understanding the short- and long-term behavior of frequency, amplitude, and modulation parameters is crucial given the difficulty of describing the operation of modern RF equipment.
Typical instruments, such as swept spectrum analyzers (SA) and vector signal analyzers (VSA), capture signals in either the frequency or modulation domains. In many cases, this is insufficient to adequately characterize the ever-changing nature of today’s RF transmissions.
Transient and dynamic RF signals present unique problems, and it developed the Real-Time Spectrum Analyzer (RTSA) architecture to overcome the measurement restrictions of the SA and VSA. Digital signal processing (DSP) in real-time is used to analyze signals in the Real-Time Spectrum Analyzer before they are stored in memory.
Because of the speed at which real-time processing occurs, users may see events that would otherwise go unnoticed by traditional systems and selectively set off triggers to store those events in memory. The data stored in memory may be thoroughly evaluated across many different fields using batch processing.
LISUN has perfect spectrum analyzers for testing.
Need of Analyzers
The signal in a wireless communication system is sent from one end to the other, as is well known. To put it simply, this signal is the message that it must send to the receiving end for communication to take place.
However, the quality of the signal deteriorates throughout transmission. The signal strength has decreased mostly because of noise in both the transmission and receiver channels. As a result, we may conclude that noise reduces signal strength.
Noise in the signal reduces its transmission range and receiver’s accuracy. Because of this, the final value is not stable and instead fluctuates.
It may introduce both internal and external sources of noise into a transmission. Accordingly, we may divide noise into two categories: internal and external.
The transmission between the antennas introduces noise that may be measured quantitatively using analyzers or spectrum analyzers.
Main Types of Spectrum Analyzers
There are generally three distinct types of Spectrum Analyzers based on their design. Consistently, these three types are used:
Swept Spectrum Analyzers (SA)
The standard spectrum analysis method employs a swept-tuned, superheterodyne setup, which is optimal for keeping tabs on calibrated, constant signals. Downconverting the signal of interest allows the SA to measure power vs. frequency by sweeping the passband of the resolution bandwidth (RBW) filter.
One frequency within the selected range has its amplitude measured by a detector after passing through the RBW filter.
This method has the potential to provide a wide dynamic range, but it is limited in that it can only calculate amplitude data for a single frequency point at a time. To guarantee reliable findings, testing should be limited to input signals that are relatively stable across time.
Vector Signal Analyzers (VSA)
Vector measurements get magnitude and phase information while studying digitally modulated signals. The VSA digitizes and stores the RF power waveform generated by any source inside the instrument’s passband.
For demodulation, measurements, and display processing, digital signal processing (DSP) may use the magnitude and phase information associated with the waveform in memory.
Even though it can now store waveforms in memory, the VSA is still unable to provide a comprehensive assessment of transient occurrences. Since most instruments operate in a batch processing mode, they are blind to events between acquisitions.
Due to the difficulty in reliably detecting uncommon or infrequent occurrences, external triggering is often necessary; this, in turn, might demand an unreasonable level of foreknowledge of the events themselves.
Similarly, the VSA struggles with weak signals in the presence of larger ones and with signals that change in frequency but not amplitude.
Real-time Spectrum Analyzers (RSA)
In contrast to the post-acquisition processing typical of the VSA, the RSA conducts signal analysis utilizing real-time digital signal processing (DSP) prior to memory storage.
Processing data in real-time enables the user to detect and react to occurrences that would otherwise go unnoticed by alternative designs, therefore selectively capturing the relevant data for later use. The data stored in memory may then be subjected to in-depth, cross-domain analysis through batch processing.
Signal conditioning, calibration, and other forms of analysis are also accomplished with the aid of the real-time DSP engine.
What do spectrum analyzers measure?
The amplitude of a signal at various frequencies may be seen on a spectrum analyzer. It makes it possible to test whether signals are within acceptable ranges. It shows artifacts such as noise, complicated waveforms, infrequent occurrences, and erroneous signals.
Transient signals may be examined using spectrum analyzers, as can burst broadcasts, glitches, and the phenomenon of stronger signals hiding weaker ones.
The frequency spectrum of time-varying modern RF and audio signals are often analyzed using such tools. They show the signal’s constituent parts and how well the circuitry behind them is functioning. Companies also utilize them to assess whether their Wi-Fi networks and wireless routers may benefit from interference reduction changes.
Applications of Analyzer
Signals at frequencies other than the communications frequency show up as vertical lines on a spectrum analyzer’s display (pips). Because of this, it may use them to check whether a wireless transmitter operates within its allotted frequency range and without interfering with other bands, as government-defined emissions purity requirements.
Spectrum analyzers have several applications in the electronics industry, including but not limited to RF design and testing, electronic circuit design, electronic manufacturing, and electronic maintenance.
In addition to its primary function of testing, a spectrum analyzer’s measurement range is rather broad. Every one of these readings is taken at a radio frequency. These are some of the most often measured quantities when using a spectrum analyzer-
Signal levels– One may use a spectrum analyzer to determine the signal’s amplitude in the frequency domain.
Phase Noise – it may readily detect phase noise by measuring the spectral content and doing the measurements in the frequency domain. Cathode ray oscilloscope output shows waves as a result.
Harmonic distortion – This is a crucial question before evaluating the signal strength. Total harmonic distortion (THD) is used to assess signal strength. There has to be protection for the signal against fluctuations. Achieving a low degree of harmonic distortion is also crucial to preventing wasteful energy and money losses.
Intermodulation distortion– While modulating the signal, intermediate-level distortions are introduced depending on whether the signal is being modulated at a high or low frequency. To get a processed signal, it must eliminate this distortion.
Intermodulation distortion is measured using a spectrum analyzer for this purpose. Processing of the signal might begin once it has been cleaned up by external circuitry.
Spurious Signals– These potentially harmful signals must be identified and blocked. There is no direct method of measuring these signals. Until they are quantified, they remain an uncharted signal.
Signal Frequency– Likewise, it must consider this. It is crucial to measure the frequency content of each signal since the spectrum of frequencies is so wide due to our usage of the analyzer at the radio frequency level. To study this spectrum, specialized equipment is required.
Spectral Masks – When examining spectral masks, spectrum analyzers are also useful.
Other applications of the spectrum analyzer
Lisun Instruments Limited was found by LISUN GROUP in 2003. LISUN quality system has been strictly certified by ISO9001:2015. As a CIE Membership, LISUN products are designed based on CIE, IEC and other international or national standards. All products passed CE certificate and authenticated by the third party lab.
Our main products are Goniophotometer, Integrating Sphere, Spectroradiometer, Surge Generator, ESD Simulator Guns, EMI Receiver, EMC Test Equipment, Electrical Safety Tester, Environmental Chamber, Temperature Chamber, Climate Chamber, Thermal Chamber, Salt Spray Test, Dust Test Chamber, Waterproof Test, RoHS Test (EDXRF), Glow Wire Test and Needle Flame Test.
Please feel free to contact us if you need any support.
Tech Dep: [email protected], Cell/WhatsApp:+8615317907381
Sales Dep: [email protected], Cell/WhatsApp:+8618117273997

 中文简体
中文简体