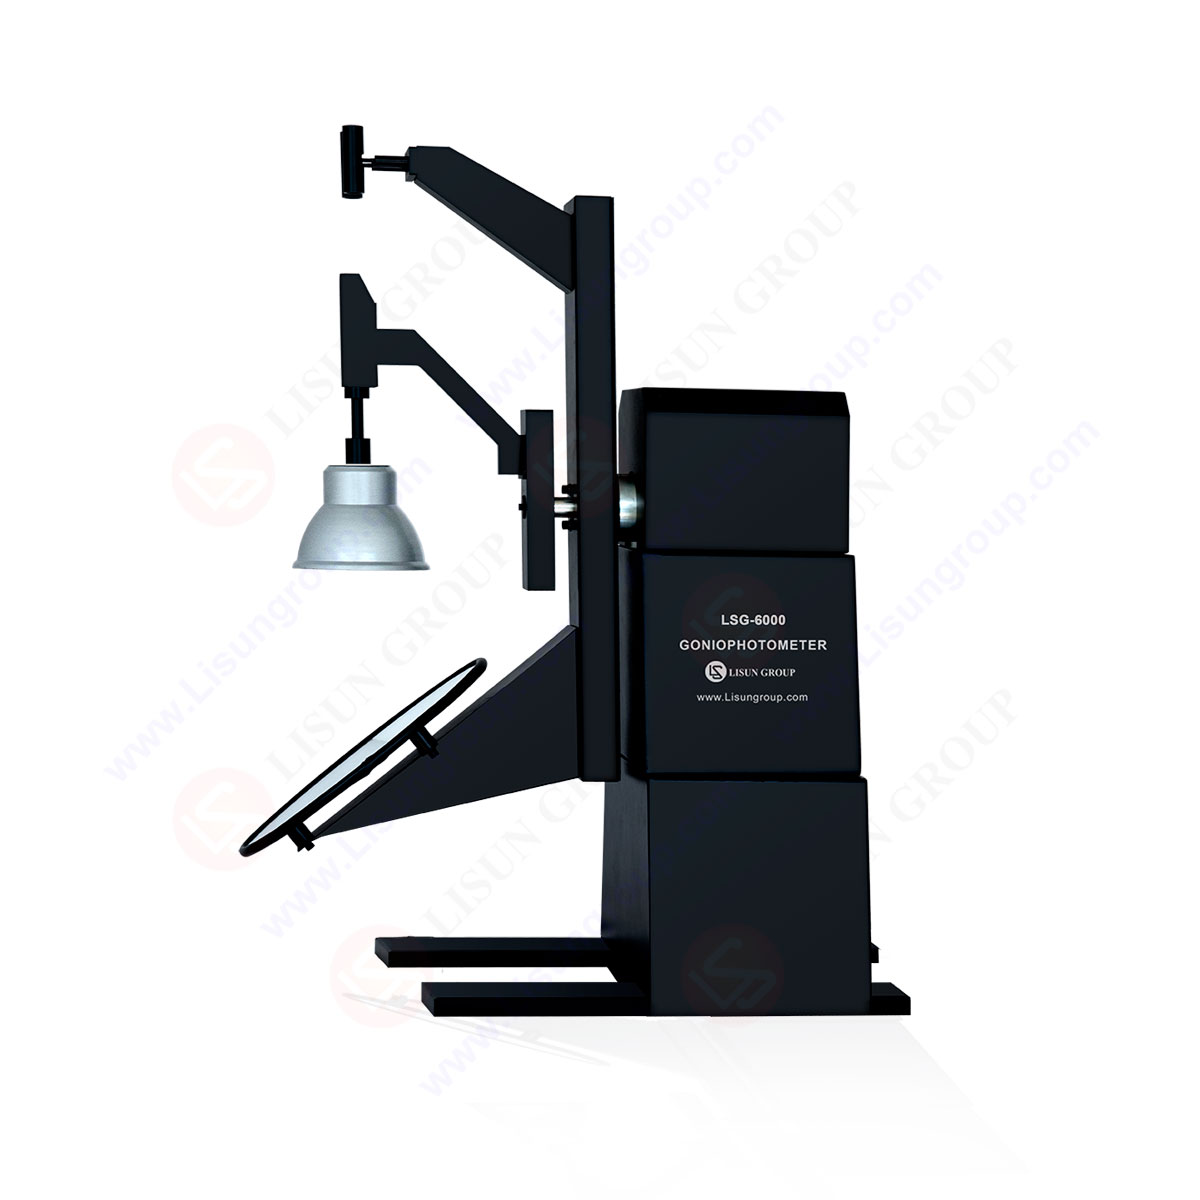
LM-79 Moving Detector Goniophotometer (Mirror Type C)
LSG-6000
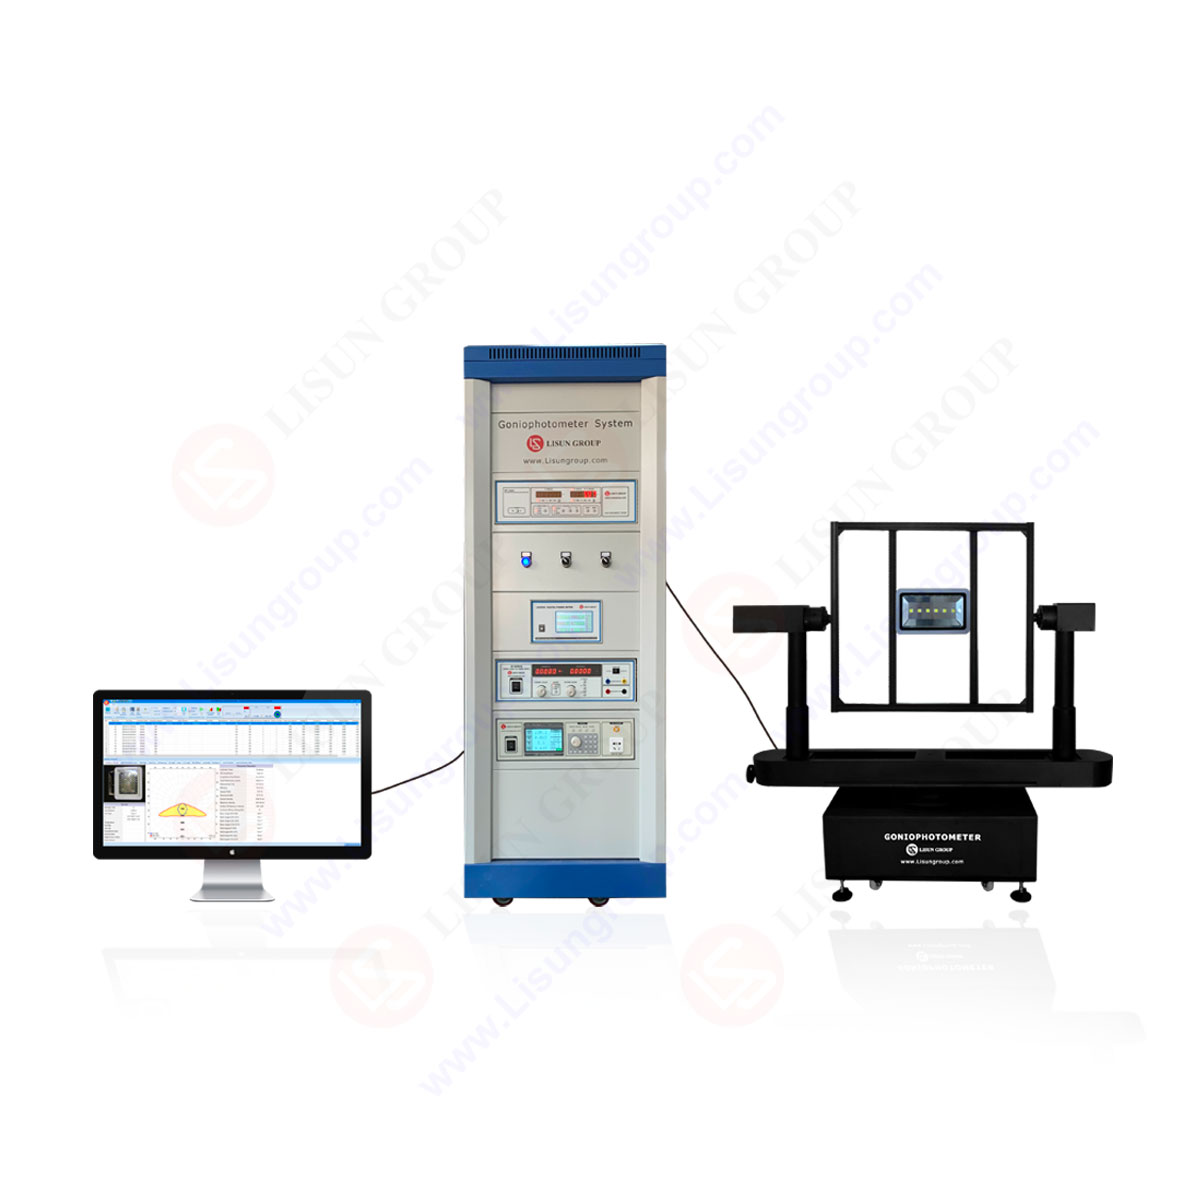
High Precision Rotation Luminaire Goniophotometer
LSG-1890B
High Precision Rotation Luminaire Goniospectroradiometer
LSG-1890BCCD
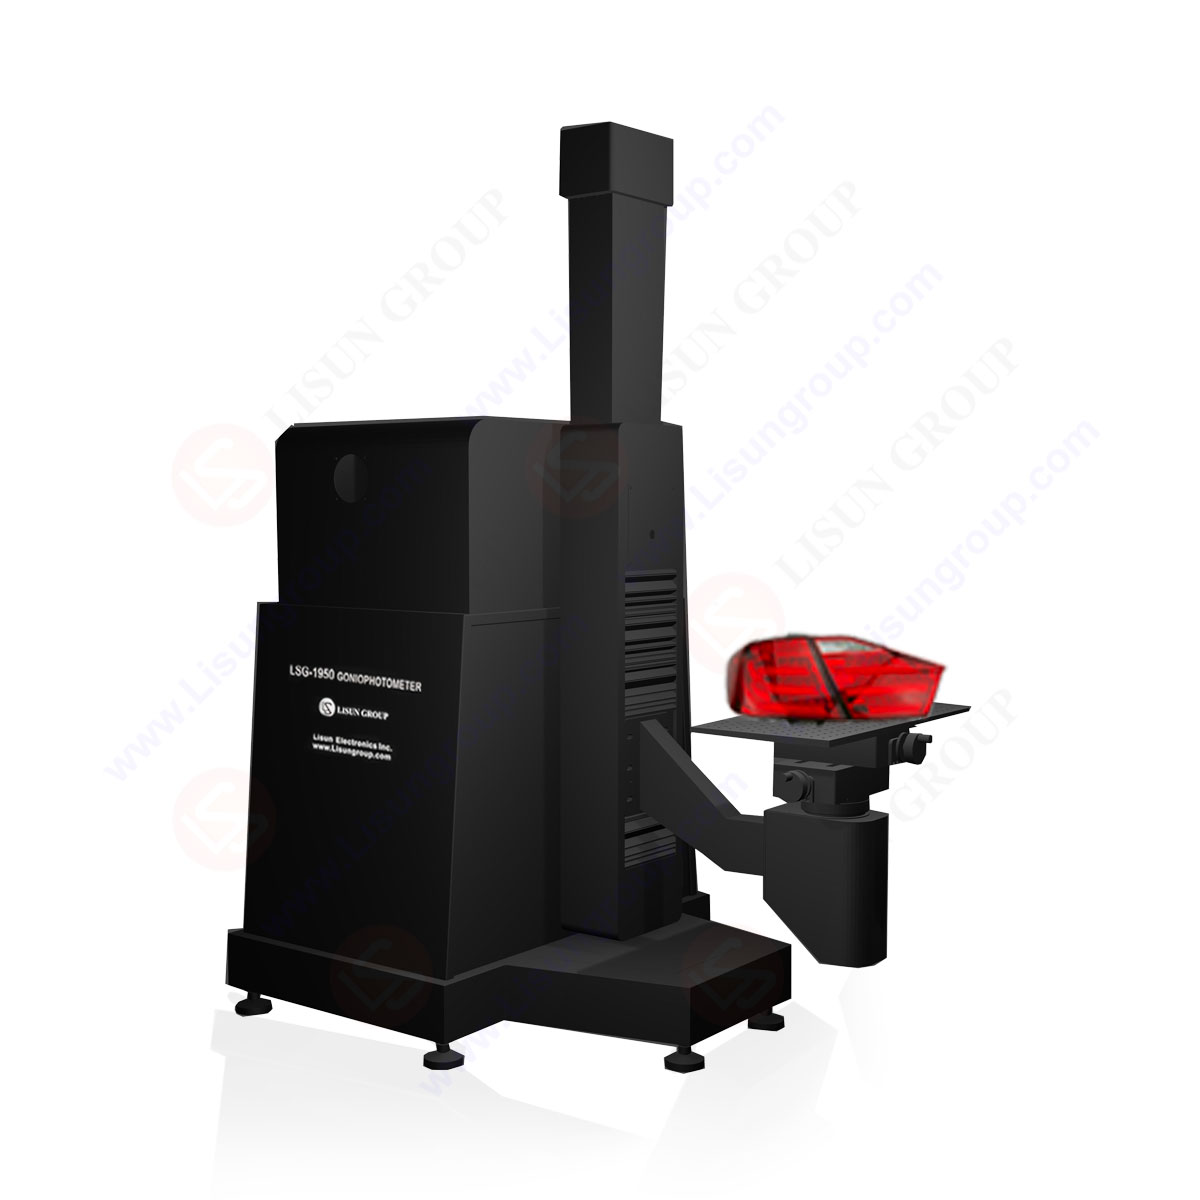
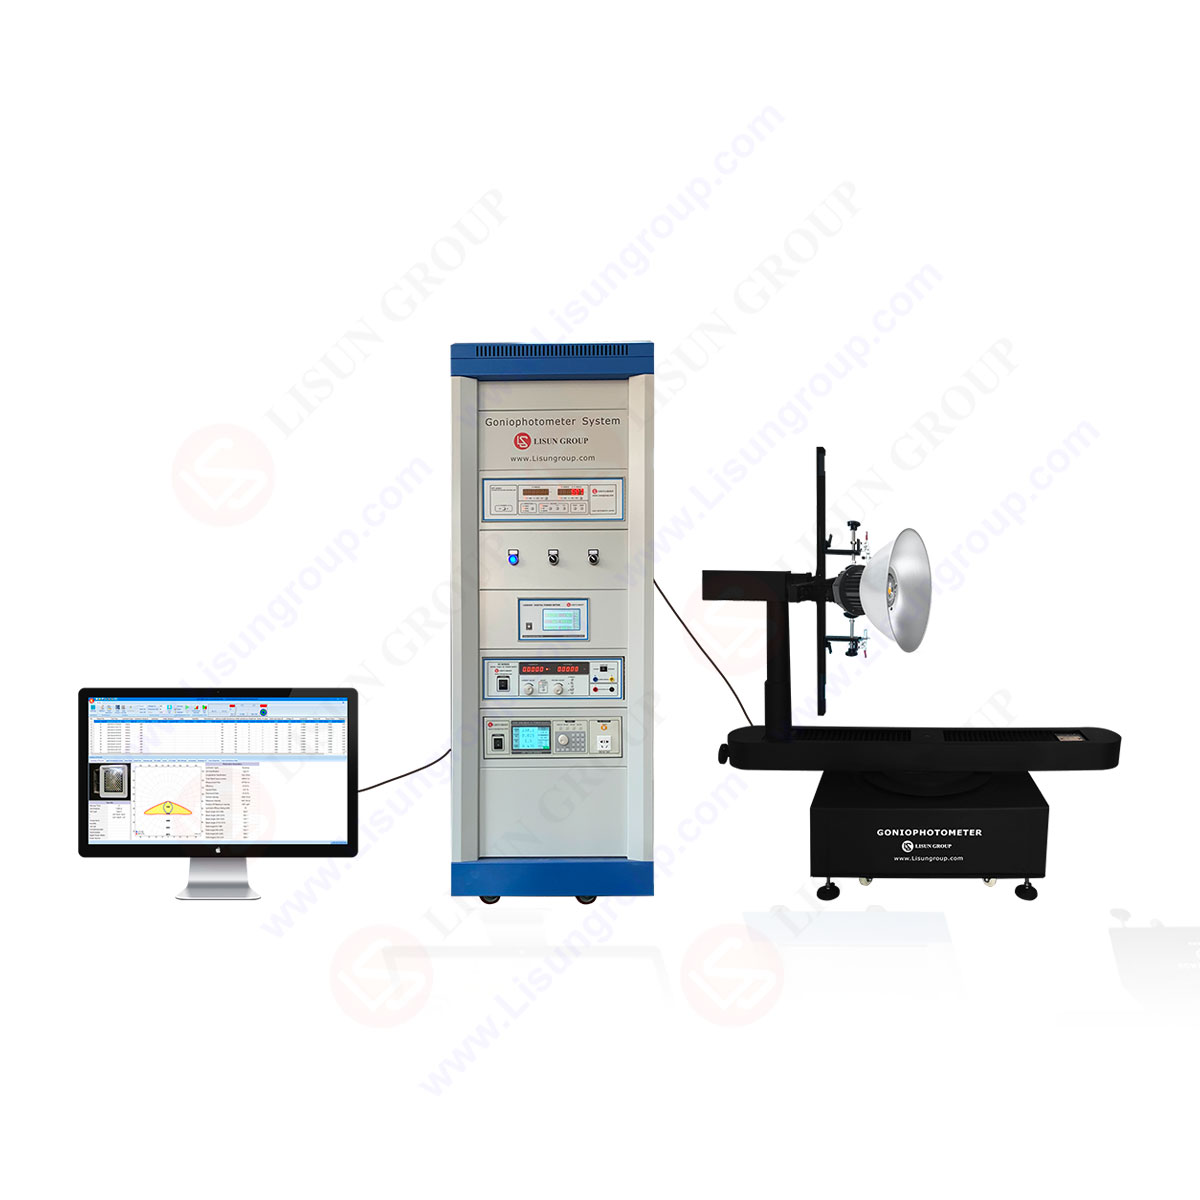
Goniophotometer for Automotive and Signal Lamps
LSG-1950
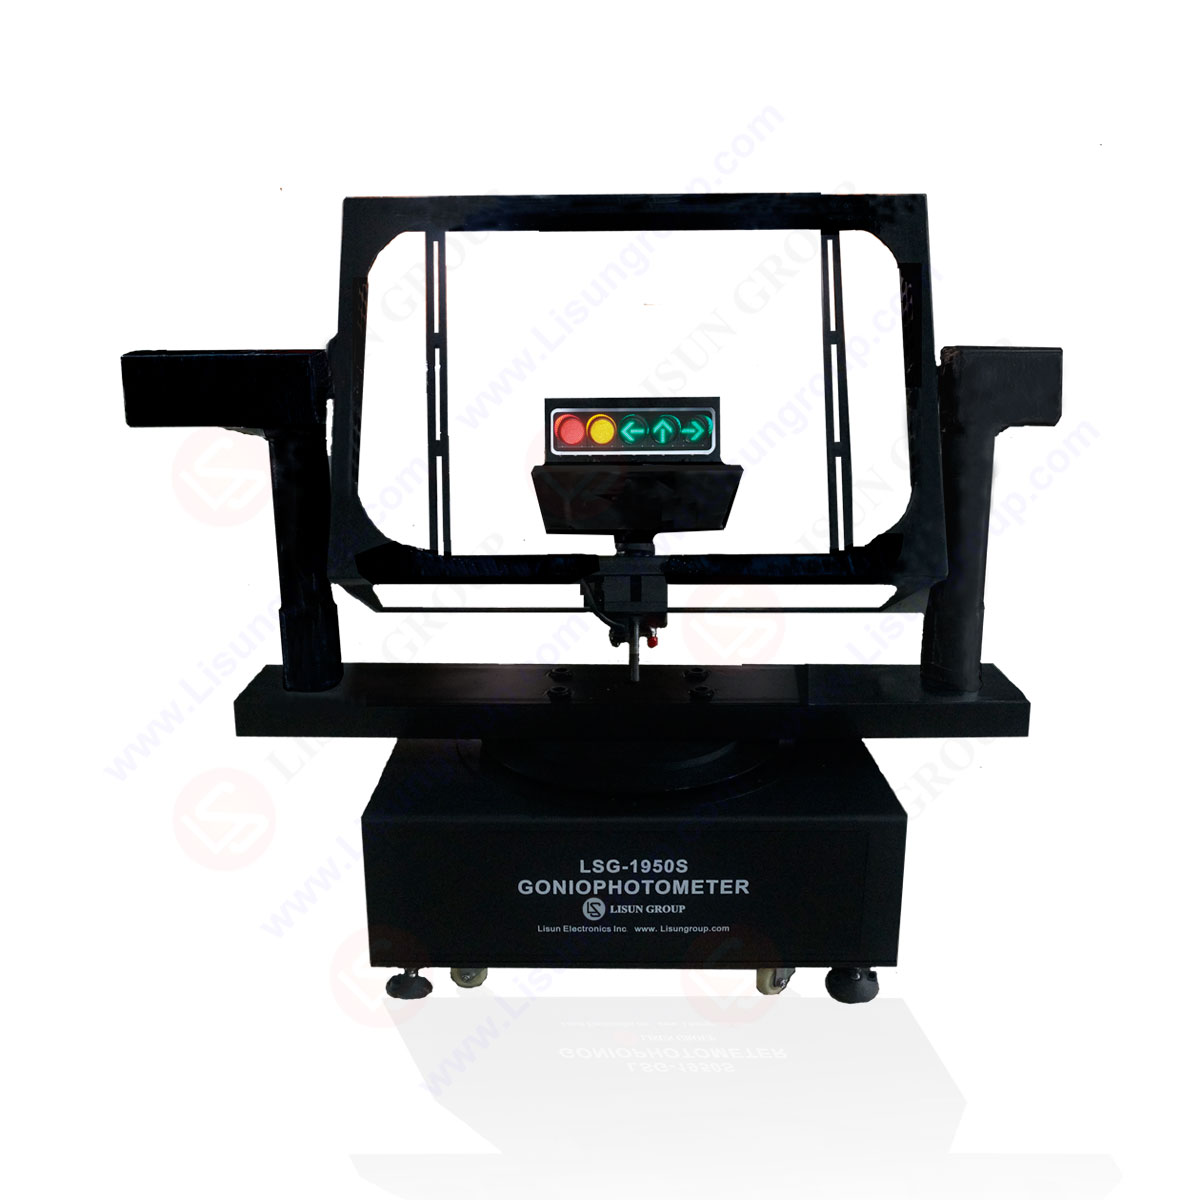
Goniophotometer for Traffic Signal Lamps
LSG-1950S
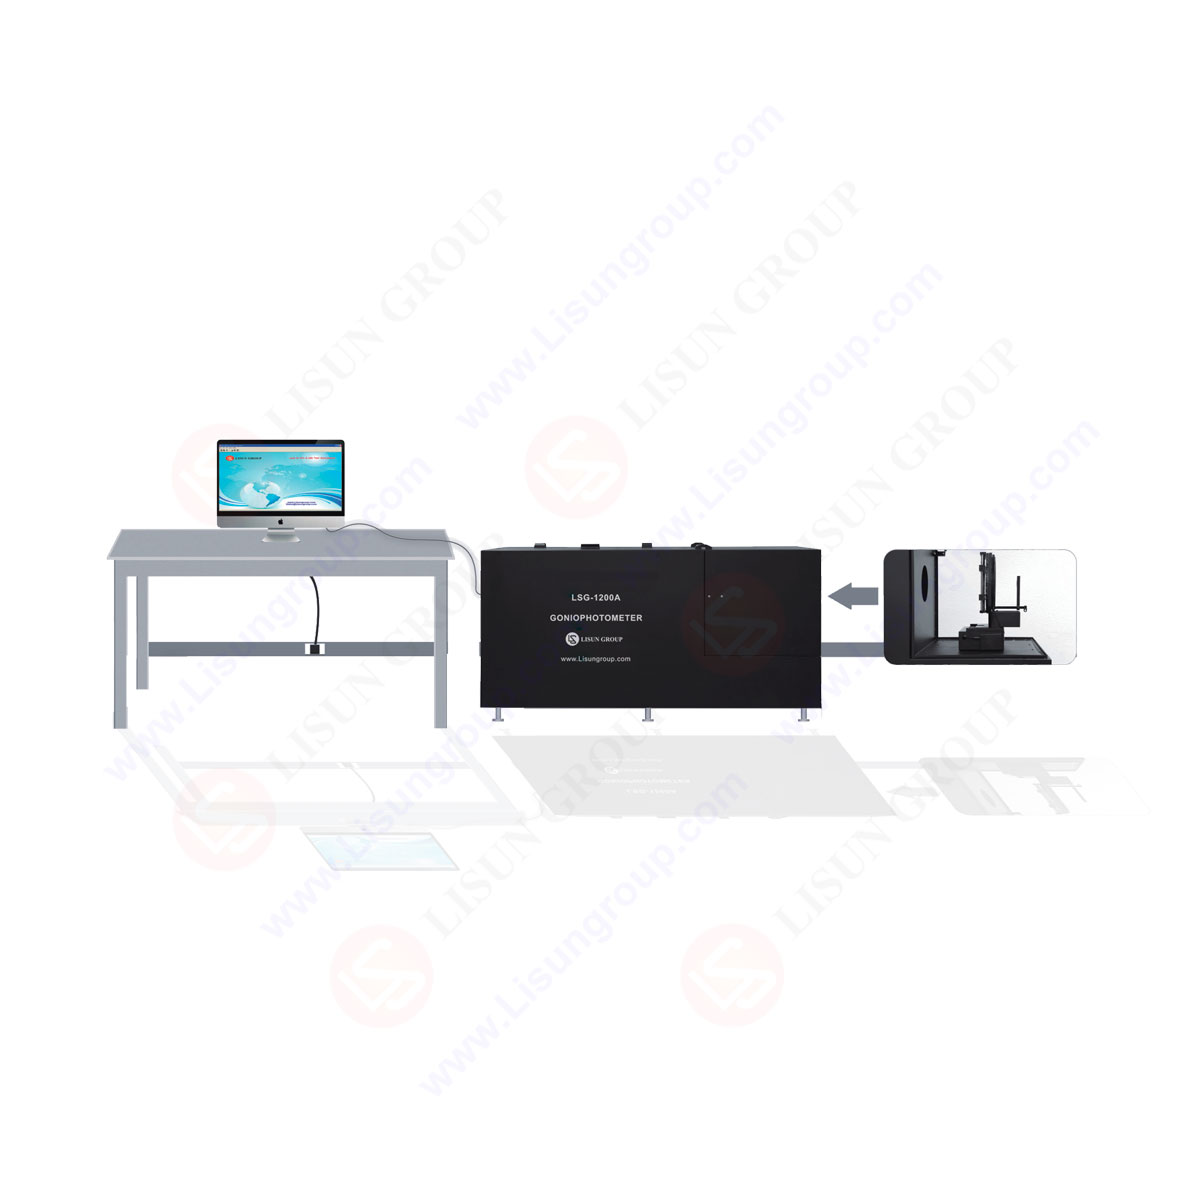
Compact Goniophotometer
LSG-1200A

Near Field Moving Detector Goniophotometer
LSG-1900B
Select an organization
to browse standards
Introduction
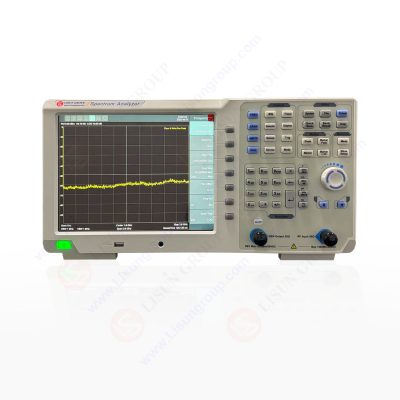
Spectrum analyzers are useful pieces of equipment for researching the characteristics of electromagnetic signals across a wide frequency range because of their ability to provide accurate results.
While they do provide the fundamentals for frequency domain analysis, they also provide more advanced qualities that may assist us in gaining a deeper comprehension of the nuances that are present in signals.
This article’s objective is to investigate some cutting-edge techniques that may be of assistance to professionals in making more effective use of spectrum analyzers.
Learning about these methodologies might help you become a better analyst, learn more, and make better decisions in a variety of fields, such as RF engineering, electronics, and telecommunications, among others.
Time-Domain Analysis
Although spectrum analyzers also have analytical capabilities in the time domain, the majority of the work that they undertake takes place in the frequency domain. Because of this ability, we are able to evaluate signals over long periods of time and investigate transitory occurrences.
The assessment of transient interference, the measuring of rise and fall times, and the detection of signal abnormalities are just three of the numerous applications that may be accomplished using time-domain analysis.
You may utilize the time-domain view or waveform display on the spectrum analyzer if what you really want to observe is how a signal changes over the course of time. It is possible to witness glitches, transients, or modulation variations in the amplitude and shape of the waveform that would otherwise go unnoticed in the frequency domain.
This is due to the fact that the amplitude and shape of the waveform are in the time domain. This cutting-edge approach makes it possible to have a comprehensive understanding of signal qualities and makes it easier to fix complex problems.
Spectrogram Analysis
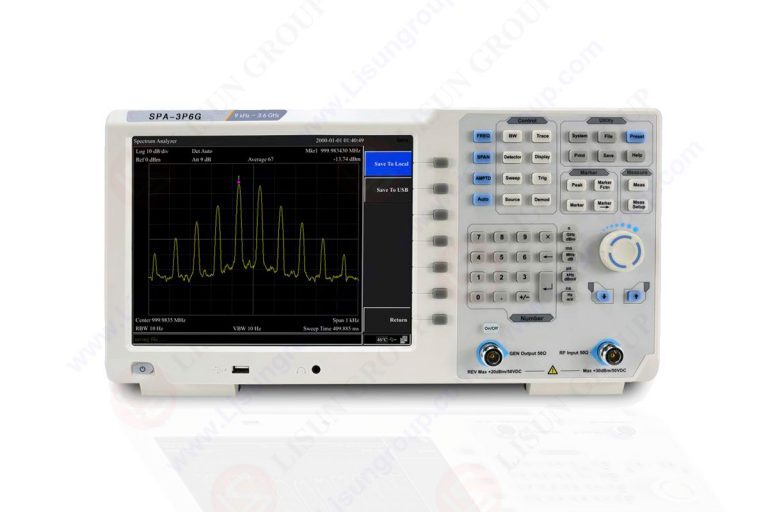
A spectrogram is a powerful instrument that may be used in signal analysis. It depicts the time-frequency composition of the signal that is being investigated and is one of the strongest instruments available. A spectrogram is a feature that may be found on a variety of spectrum analyzers. LISUN uses new technology in spectrum analyzers.
This function gives users the ability to track, in real time, how the spectral content of a signal is changing over time. This skill is often referred to as a “spectrogram.” Because of this, it is now feasible to detect and investigate the temporal behavior of intermittent or dynamic frequency components. This was made possible as a consequence of the fact that.
You will be able to identify signals that hop from frequency to frequency, variations in modulation, and short occurrences by making use of spectrogram analysis. You may be able to get important insight into the dynamics of a signal by analyzing the spectrogram of the signal and finding the specific timestamps at which changes occurred in the signal’s spectral profile. This will allow you to determine when the changes occurred.
The following are some applications in which frequency agility analysis, cognitive radio, and dynamic spectrum management may all benefit greatly from using this technology:
Noise Figure Measurement
It is possible to evaluate the functionality of radio frequency (RF) systems, amplifiers, and receivers by taking measurements of the noise figure. Spectrum analyzers that have the ability to measure noise figures are essential for accurately quantifying the noise contributions that are made by a system. This method is useful for evaluating the signal-to-noise ratio (SNR) of the system that is being examined as well as the overall noise performance of the system.
Connect the output of the device under test (DUT) to the input of the spectrum analyzer so that you may get a reading of the noise figure. In order to compute the noise figure, you will first need to connect a reference noise source to the analyzer, after which you will need to set the analyzer to its noise source measurement mode.
When the noise power of the DUT is measured and compared to the noise power of the reference source, the spectrum analyzer is then able to calculate the noise figure for the system.
It is possible to get a very accurate measurement of the noise performance of RF components and systems by making use of the capabilities for measuring the noise figure. This makes it possible to optimize the receiver’s sensitivity, evaluate the system’s noise contributions, and locate likely noise sources.
Intermodulation Distortion Analysis
Intermodulation distortion, often known as IMD, is a crucial quantity that determines how linear radio frequency (RF) circuits and amplifiers are. Spectrum analyzers that are also capable of doing intermodulation analysis make it possible to conduct precise measurements and characterizations of IMD.
In order to successfully complete an IMD analysis, it is necessary to apply at least two tones to the input of the DUT. When carrying out this task, it is essential to make certain that the frequency range of the DUT’s working tones is accommodated by the tones that are being applied.
The spectrum analyzer is going to be able to recognize and display the intermodulation products that were generated as a result of the nonlinearities that were present in the DUT. The linearity and distortion properties of the DUT may be evaluated by looking at the relative amplitude and frequency of these components. This will supply you with information on the behavior of the DUT.
IMD analysis is important in finding nonlinearities that may contribute unwanted spurious signals, distortion, or a decrease in signal quality. This may be accomplished by determining whether or not a signal has been degraded.
These nonlinearities might have been brought on by any one of a variety of distinct factors. If you are able to obtain a firm handle on the IMD characteristics of RF components, amplifiers, or systems, you will be able to make decisions that are more informed with regard to the selection of components, the design of systems, and the enhancement of performance.
Conclusion
Using sophisticated spectrum analysis techniques, which unlock the full potential of spectrum analyzers, professionals have the potential to gain more insight into the behavior of signals and provide a more comprehensive picture of the situation. The examination of a spectrogram is able to capture the dynamic changes in the spectral content over time, while the time-domain analysis is only able to reveal transient occurrences and abnormalities.
One way to evaluate a system’s linearity may be accomplished by analyzing the intermodulation distortion, and another way can be accomplished by measuring the noise figure. Both of these ways can be used to determine the figure of noise.
Technologists in fields as varied as telecommunications, radio frequency engineering, and electronics may all profit from these cutting-edge technologies by better interpreting intricate signals, resolving challenging challenges, and making intelligent judgements.
When such capabilities are included in spectrum analyzers, users are granted the capacity to make more accurate measurements, fine-tune the functioning of the system, and boost their overall level of productivity.
This is made possible as a result of the instrument’s ability to take use of the full capability of the instrument. Experts may be able to confidently take on tough jobs and uncover new uses for spectrum analysis if they get a deeper understanding of signals and how they behave.
Lisun Instruments Limited was found by LISUN GROUP in 2003. LISUN quality system has been strictly certified by ISO9001:2015. As a CIE Membership, LISUN products are designed based on CIE, IEC and other international or national standards. All products passed CE certificate and authenticated by the third party lab.
Our main products are Goniophotometer, Integrating Sphere, Spectroradiometer, Surge Generator, ESD Simulator Guns, EMI Receiver, EMC Test Equipment, Electrical Safety Tester, Environmental Chamber, Temperature Chamber, Climate Chamber, Thermal Chamber, Salt Spray Test, Dust Test Chamber, Waterproof Test, RoHS Test (EDXRF), Glow Wire Test and Needle Flame Test.
Please feel free to contact us if you need any support.
Tech Dep: [email protected], Cell/WhatsApp:+8615317907381
Sales Dep: [email protected], Cell/WhatsApp:+8618117273997

 中文简体
中文简体