LM-79 Moving Detector Goniophotometer (Mirror Type C)
LSG-6000
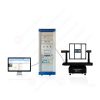
High Precision Rotation Luminaire Goniophotometer
LSG-1890B
High Precision Rotation Luminaire Goniospectroradiometer
LSG-1890BCCD

Goniophotometer for Automotive and Signal Lamps
LSG-1950
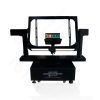
Goniophotometer for Traffic Signal Lamps
LSG-1950S
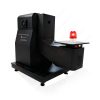
VAD Fire Alarm Visual Alert Device Goniophotometer
LSG-1930
Compact Goniophotometer
LSG-1200A
LED Goniophotometer
LSG-1100
 LEDs and Luminaire Test Solutions
 LM-79 and LM-80 Test Solutions
 LED Driver Test Solutions
 Household Appliances Test Solutions
 Mobile and Network Test Solutions
 Automotive Electronics Test Solutions
 Audio-Video and IT Test Solutions
 Cable and Wire Test Solutions
 Plugs and Sockets Test Solutions
 Power Switch Test Solutions
 Transformer Test Solutions
 Electric Toys Test Solutions
 Energy Meter Test Solutions
 Motor-Operated Tool Test Solutions
Select an organization
to browse standards
Abstract
Light intensity serves as the core optical indicator of lighting products, and how to measure light intensity lays the foundation for luminaire photometric testing, product energy efficiency certification, and lighting design simulation. Taking the LISUN LSG-1890B High Precision Goniophotometer (Luminous Intensity Distribution Curve) as the test instrument, this paper elaborates on the underlying principles and standardized operation procedures for measuring light intensity. It comprehensively covers the testing methods of more than ten photometric parameters including luminous intensity data, luminous intensity distribution, zonal luminous flux, luminaire efficiency, luminance distribution, utilization factor, luminance limiting curve, UGR glare rating, EEI energy efficiency index, isolux curve, isocandela curve, effective beam angle, maximum permissible spacing height ratio, matching of luminaire curves with lighting areas, as well as luminance limiting curves. Measured data tables are attached to provide standardized references for photometric testing of LED, HID and fluorescent luminaires in laboratories. This instrument fully complies with international testing standards including CIE-70, LM-79-19 and EN13032-1.
1 Instrument Overview & Basic Principles of Measuring Light Intensity
1.1 Core Configuration of LSG-1890B
The LSG-1890B is a European standard Type 1 goniophotometer equipped with a constant-temperature photometric probe, Mitsubishi servo motors from Japan and high-precision German decoding devices, delivering angular measurement accuracy of 0.1°. Its photometric probe meets CIE Class A precision. It supports dual test modes including C-γ single-arm and B-β double-arm. The maximum size of tested luminaires is Φ2000mm × 600mm with a maximum load capacity of 60kg, suitable for full ranges of lighting products such as indoor LED panel lights, street lamps, floodlights and HID light sources. Matched Chinese-English measurement and control software can export general formats including IES, LDT, CIE and Excel, which can be directly connected to Dialux lighting simulation software.
1.2 Core Principles of How to Measure Light Intensity
The measurement of luminous intensity (unit: cd, candela) follows the inverse square law of distance: I=E×d2, where I refers to luminous intensity in the tested direction, E is illuminance (lx) collected by the constant-temperature probe, and d represents the fixed test distance between the probe and the luminaire’s luminous center.
The LSG-1890B adopts the “fixed luminaire + full-sphere probe scanning” structure. Under the C-γ coordinate system, the C angle rotates horizontally ±180° and the γ angle rotates vertically ±180°. The probe collects illuminance values point by point along the spherical surface, and the software converts them into a 3D spatial luminous intensity matrix in real time to complete raw data acquisition of light intensity, which serves as the basis for integrating and calculating all derived photometric parameters. The constant-temperature probe eliminates errors caused by ambient temperature drift during light intensity collection and guarantees stable data during long-time scanning.
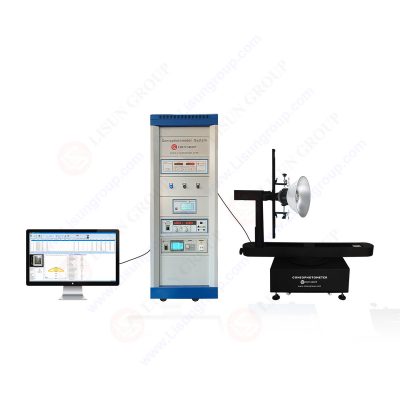
High Precision Rotation Luminaire Goniophotometer LSG 1890B AL1
2 Standardized Operation Procedures for Measuring Light Intensity with LSG-1890B
2.1 Pre-test Preparation
1. Equipment preheating and system calibration: Preheat the instrument for 30 minutes after startup, and conduct absolute calibration on the constant-temperature probe with a standard luminous intensity lamp to eliminate probe response deviation. Complete full blackout of the darkroom and remove reflective debris on the light path, maintaining ambient temperature at 23℃±2℃.
2. Luminaire installation and positioning: Fix the luminaire with a multi-functional fixture, calibrate the coincidence of the luminaire’s luminous center and turntable origin via a laser aligner, and install the luminaire according to its actual use posture. Connect a high-precision power meter synchronously to collect electrical parameters.
3. Sample thermal stabilization: Power on the luminaire at rated voltage, and start scanning after the luminous flux fluctuation is less than 0.5% per 10 minutes. The thermal stabilization period for LED luminaires shall not be less than 30 minutes.
4. Software parameter setting: Select the C-γ test mode, set angular steps as γ=2°, C=5°, check full parameter calculation modules (luminance, UGR, EEI, utilization factor, etc.), and set data export formats.
2.2 Full-sphere Luminous Intensity Scanning (Core Step: How to Measure Light Intensity)
1. The instrument servo mechanism drives the constant-temperature probe to automatically scan along the spherical trajectory. When each group of (C, γ) coordinates is reached, the probe collects illuminance E in that direction.
2. The software outputs the luminous intensity value of that angle in real time via the formula I=E×d2 and stores it as raw luminous intensity data table.
3. After full-sphere scanning is completed, the system automatically calculates derived parameters such as zonal luminous flux, luminaire efficiency and isocandela curves through spherical solid angle integration algorithms based on all luminous intensity matrices.
4. A German Class L high-precision PHOTO-VIS-L probe can be optionally configured to improve the measurement accuracy of light intensity for low-power LEDs and precision light sources. UVA/UVB/UVC probes can expand the test of luminous intensity distribution for ultraviolet light sources.
2.3 Post-processing & Report Generation
After scanning, the software automatically plots luminous intensity distribution curves, isolux diagrams and isocandela diagrams, outputs indicators including UGR glare, EEI energy efficiency, spacing-height ratio and utilization factor, and can export Excel raw luminous intensity data and IES standard luminous intensity files.
3 Testing Methods for Full Series of Photometric Parameters (Based on Raw Measured Light Intensity Data)
All parameters are calculated based on full-sphere measured luminous intensity data. The testing logic of each parameter is shown as follows:
1. Luminous intensity data & luminous intensity distribution: Directly output cd values corresponding to each (C, γ) angle to form a 3D luminous intensity distribution matrix and generate polar coordinate luminous intensity curves.
2. Zonal luminous flux: Integrate luminous intensity within specified solid angle intervals (upper hemisphere/lower hemisphere/beam angle interval) to obtain corresponding zonal luminous flux (lm).
3. Luminaire efficiency: Zonal luminous flux divided by luminaire input electric power, unit: lm/W.
4. Luminance distribution (optional): Match with imaging luminance probe to convert the luminous intensity of corresponding angles into a luminaire surface luminance matrix.
5. Utilization factor: Calculate indoor lighting light utilization rate by matching spatial luminous intensity distribution with room space ratios of different spaces.
6. Luminance limiting curve: Extract luminance data at observation angles from 45° to 90° and draw anti-glare limiting curves.
7. UGR glare rating: Calculate unified glare value automatically by using luminous intensity within the observation viewing angle, light source solid angle and background luminance in accordance with CIE 117 standard.
8. Isolux curve & maximum permissible spacing height ratio: Take the ground plane as the receiving surface, calculate ground illuminance distribution through superposition of full-sphere luminous intensity, and deduce the maximum allowable spacing-height ratio for luminaire installation.
9. Matching of luminaire curves vs lighting areas: Simulate ground illuminance coverage under different installation heights to match application scenarios such as road and office lighting.
10. Isocandela curve: Form equivalent curved surfaces by connecting angles with equal spatial luminous intensity values.
11. Effective beam angle: The difference between two side γ angles corresponding to 50% of maximum luminous intensity.
12. EEI energy efficiency index: Calculate energy efficiency grading index by comparing luminous efficacy with standard reference luminaires under EU 2019/2015 ErP Directive.
4 Measured Sample Data Table of LSG-1890B
A 100W LED floodlight is selected as the test sample, and core photometric data scanned by LISUN LSG-1890B are listed below:
| Test Item | Measured Value | Unit | Test Basis |
| Central luminous intensity at 0° (core light intensity) | 12680 | cd | CIE-70 Method for How to Measure Light Intensity |
| Effective beam angle | 58 | ° | Calculation of included angle at 50% maximum luminous intensity |
| Zonal luminous flux of lower hemisphere | 9260 | lm | Solid angle integration of full-sphere luminous intensity |
| Luminaire input power | 98.5 | W | Synchronous electrical parameter collection |
| Luminaire efficiency | 94 | lm/W | Zonal luminous flux / Input power |
| UGR unified glare rating | 18.3 | — | CIE 117 glare calculation algorithm |
| EEI energy efficiency index | 0.86 | — | EU 2019/2015 Standard |
| Maximum permissible spacing height ratio | 1.75 | — | Calculated with ground isolux threshold of 300lx |
| Total utilization factor (room space ratio = 1.0) | 0.82 | — | Matching spatial luminous intensity distribution with room model |
| Proportion of upper hemisphere luminous flux | 7.2 | % | Ratio of upper and lower hemisphere luminous flux |
| Luminance at 45° observation direction | 1860 | cd/m² | Synchronous collection with optional luminance probe |
Excerpt of luminous intensity distribution (typical γ angle luminous intensity data on C=0° plane):
| Vertical γ Angle | 0° | 15° | 30° | 45° | 60° | 75° | 90° |
| Luminous Intensity I (cd) | 12680 | 11250 | 8630 | 4210 | 1560 | 420 | 86 |

5 Instrument Advantages & Industrial Application Value
1. High precision for how to measure light intensity: 0.1° angular accuracy plus CIE Class A constant-temperature probe significantly reduces light intensity collection error at small angles compared with LSG-1800A (0.2°), meeting testing requirements for high-end LEDs and precision optical products.
2. Comprehensive standard coverage: Compatible with global CIE, North American IES, European EN and EU ErP directives simultaneously, and can issue luminous intensity test reports required for global certifications.
3. Wide adaptability for various light sources: Testable for visible light, UVA/UVB/UVC ultraviolet light sources, covering disinfection lamps, curing light sources and full categories of outdoor lighting.
4. Practical engineering value: One single scanning completes all 15 photometric parameters without repeated testing on multiple instruments, greatly shortening laboratory testing cycles. Exported IES files can be directly applied to lighting simulation design for roads, classrooms and factories.
6 Conclusion
How to measure light intensity is the fundamental step in luminaire optical performance testing. Equipped with a constant-temperature probe and high-precision servo scanning system, the LISUN LSG-1890B High Precision Goniophotometer accurately collects full-sphere raw luminous intensity data based on the inverse square distance law. Built-in standard algorithms can simultaneously calculate a full set of photometric parameters including luminous intensity distribution, luminous flux, luminaire efficiency, UGR, EEI, isolux curves and more. This instrument features standardized operation procedures and traceable data, fully satisfying the demands of global lighting product testing, R&D and energy efficiency certification. It serves as the core testing instrument for laboratories to realize full-dimensional photometric performance detection.
Tags:LSG-1890BYour email address will not be published. Required fields are marked *
 English
 中文简体
中文简体 English
 Русский
 Español
 Português
 Türkçe
 العربية
 Deutsch
 Polski
 Italiano
 Français
 한국어
한국어 ไทย
ไทย Tiếng Việt
 日本語
日本語