
 English
 中文简体
中文简体 English
 Русский
 Español
 Português
 Türkçe
 العربية
 Deutsch
 Polski
 Italiano
 Français
 한국어
한국어 ไทย
ไทย Tiếng Việt
 日本語
日本語

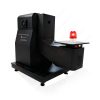
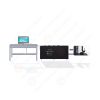
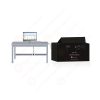
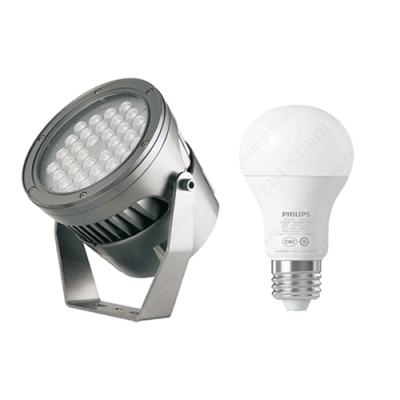










High Precision Spectroradiometer Integrating Sphere System
User's Manual
Applicable LISUN models: LMS-9000C、LMS-9000CVIS-NIR、LMS-9500C、LMS-9500CVIS-NIR、LPCE-2(LMS-9000C)、LPCE-2(LMS-9500C)
1. Unboxing and Basic Familiarization with the Equipment
1.1 Key Technical Specifications
| Model | LMS-9000C | LMS-9000CUV-VIS | LMS-9000CVIS-NIR | LMS-9000CUV |
| Wavelength | 350–800 nm | 200–800 nm | 350–1050 nm | 200–400 nm |
| Model | LMS-9500C | LMS-9500CUV-VIS | LMS-9500CVIS-NIR | LMS-9500CSWIR |
| Wavelength | 350–800 nm | 200–800 nm | 350–1050 nm | 800–1700 nm |
1.2 Unboxing and Inspection
When unpacking the device, handle it gently to avoid scratching the outer casing with sharp tools. After unpacking, first inspect the exterior of the device to ensure there is no visible deformation or dents, and that the buttons are not damaged or loose. If you notice any abnormalities with the device or its accessories, do not turn it on. Please contact us immediately.
1.3 System Configuration and Overview
1.3.1 Core Hardware Components
Note: The table below lists the core hardware components of the entire system. The equipment you purchased may include only some of these components; please keep this in mind when following the instructions in this manual.
| Component Name | Model | Core Features |
| High-Precision Spectroradiometer | LMS-9000C/LMS-9500C Series | Measure spectral data and calculate chromaticity and photometric parameters |
| Large Integrating Sphere | Model: IS-*MA Note: * indicates the diameter Integrating Sphere ; standard sizes are: 1 m, 1.5 m, 1.75 m, 2 m, 2.5 m, and 3 m |
Provides a uniform diffuse reflection environment and collects optical signals from samples for testing large samples |
| Small Integrating Sphere | Model: IS-*M Note: * indicates Integrating Sphere ; standard sizes are: 0.3 m/0.5 m |
Provides a uniform diffuse reflection environment and collects optical signals from samples for testing small samples |
| Stage | / | It must be installed inside Integrating Sphere (with a diameter of at least 1 m) to allow users to mount the standard lamp and the luminaire under test. |
| Strip Light Fixtures | Applicable only to Integrating Sphere with a diameter of at least 1.5 m. During use, it can be mounted on either side of the stage to facilitate the installation of linear lights, such as LED tubes. | |
| Auxiliary Light Fixture | Installed inside Integrating Sphere large Integrating Sphere (with a diameter of at least 1 m) for mounting auxiliary lights | |
| Cross-Line Laser | Installed inside Integrating Sphere large Integrating Sphere (with a diameter of at least 1.5 m) to determine the center of Integrating Sphere | |
| Cabinet | CASE-19 | Designed to hold Spectroradiometer, power meter, and DC and AC power supplies. Includes a power strip, an RS-232 communication module, and more. |
| Power Meter | LS Series | Measure electrical parameters such as voltage, current, power, and power factor of the sample |
| DC Power Supply | DC Series | Provides a stable DC power supply for DC samples, reference lamps, and auxiliary lamps |
| AC Power | LSP Series | Provides a stable, pure sine-wave AC power supply for AC samples |
| Optical Fiber + Probe | CFO+PHOTO Series | Transmit the optical signal from Integrating Sphere to the spectrometer |
| Standard Light | SLS Series | Integrating Sphere System for Calibrating Spectroradiometer |
| Auxiliary Lights | RLS Series | Applicable only to Integrating Sphere (with a diameter of at least 1 m). Used to correct for the self-absorption effect of large luminaires and improve test accuracy. |
1.3.2 Software, manuals, certificates, etc.
At the time of shipment, a download link containing all the documents was sent via email. Please download them as soon as possible. If you missed the email, you can also contact us directly to request a new download link.
Includes software, user manuals, warranty cards, standard lamp calibration certificates, and other important documents, as well as other relevant documents.
1.4 Measurement Parameters
| Chromaticity Parameters | Chromaticity coordinates, correlated color temperature, color ratio, peak wavelength, half-width, dominant peak wavelength, color purity, color rendering index, CQS, TM-30-24 (Rf, Rg), spectrograms, etc. |
| Photometric Parameters | Luminous flux, luminous efficacy, radiant power, WPE, EQE, EEI, energy efficiency rating, pupillary luminous flux, pupillary luminous flux efficiency, pupillary factor, PAR and PPF for plant growth lights |
| Electrical Parameters | Voltage, Current, Power, Power Factor, Phase Shift Factor (DF), Harmonics |
| Optical Throughput Retention Rate Test | Luminous Flux vs. Time, Color Temperature vs. Time, Color Rendering Index vs. Time, Power vs. Time, Power Factor vs. Time, Current vs. Time, Luminous Efficiency vs. Time |
2. Precautions for Use
2.1 Electrical Safety
The system must be connected to a stable single-phase 220 V AC, 50/60 Hz power source, and ensure proper grounding with a grounding resistance of ≤1 Ω;
Do not use the equipment if the power connections are loose or the cables are damaged.
2.2 Environmental Safety
The equipment must be placed in a dry, well-ventilated environment free of dust and corrosive gases;
Ambient temperature: 15–35°C; relative humidity: ≤65% (no condensation);
Keep the equipment away from strong magnetic fields and strong electric fields.
2.3 Using Integrating Sphere
2.3.1 Internal Coating Protection
Whenever entering the interior of Integrating Sphere to perform tasks (such as installing samples or standard lamps), white gloves must be worn; direct contact with the interior coating is prohibited;
Do not use paper towels, rags, or other materials that come into direct contact with the coating to clean it. If dust accumulates, open Integrating Sphere and use a hair dryer Integrating Sphere “cool” setting to blow the dust out from the inside toward the outside (at least once a week);
Be sure to secure the sample firmly during installation to prevent it from falling and damaging the coating; if a small area of the internal coating peels off, contact LISUN to obtain coating repair materials;
If the coating inside Integrating Sphere has peeled off over a large area, or if the coating has darkened significantly due to lack of proper care, please replace Integrating Sphere.
2.3.2 Integrating Integrating Sphere Switching and Handling
Keep Integrating Sphere closed when not in use to prevent dust from entering;
Do not disassemble Integrating Sphere during transport. If disassembly is necessary under special circumstances, be sure to protect the internal coating from contamination;
2.4 Standard Lamp Operating Procedures
The standard lamp has a lifespan of one year and must be replaced when it expires;
The standard lamp is hot immediately after use; do not touch it. Allow it to cool for 10 minutes before returning it to the lamp case;
Avoid getting stains on the surface of the standard lamp; if it becomes soiled, clean it before use or replace it with a new one;
Integrating Sphere of different sizes must be used with standard lamps of the corresponding wattage (50W or 100W for large Sphères, and 10W for small Sphères).
2.5 Optical Optical Fiber Operating Procedures
Optical Fiber must not be bent excessively (minimum bend radius ≥ 10 cm). Do not step on or squeeze Optical Fiber, as this may cause damage and result in abnormal test results.
2.6 Other
For matters not covered in this manual, please proceed with caution or contact us.
3. Hardware Assembly
3.1 Cabinet Equipment Assembly
3.1.1 Introduction to the Cabinet
Place the cabinet on a level, sturdy workbench, leaving sufficient space for operation.
A wiring diagram is affixed to the inside of the rear door of the cabinet. Please assemble the equipment inside the cabinet according to the wiring diagram (see Figure 3-1).
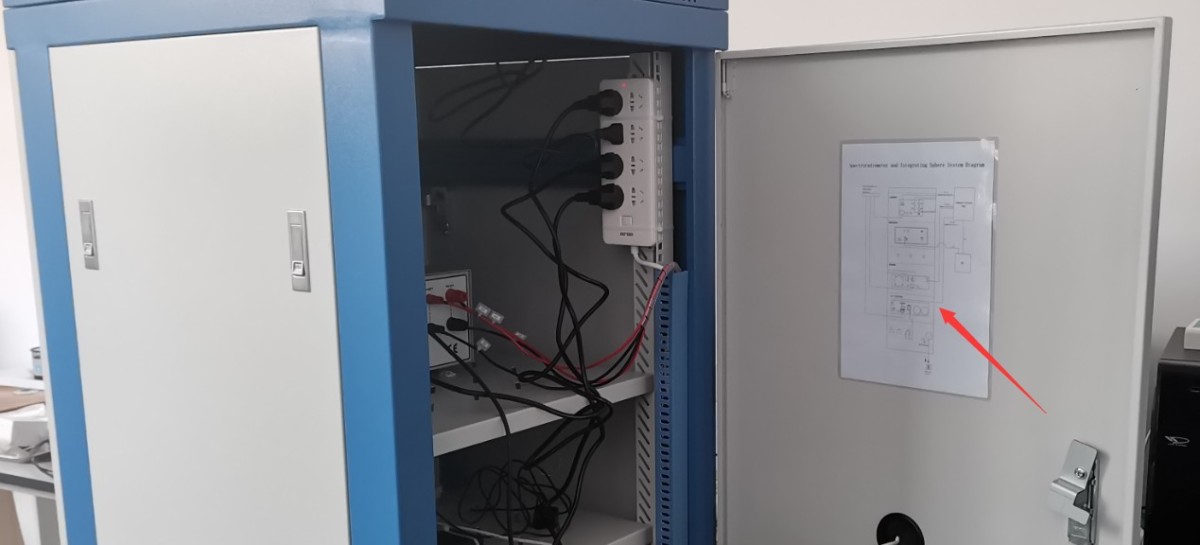
Figure 3-1
The necessary wiring for the equipment inside the cabinet has already been connected, as shown in Figure 3-2.
| Number | Note |
| ① | RS-232 Communication Box, used to connect RS-232 communication cables between devices inside a cabinet |
| ② | Power distribution panel, used to connect the power cords of equipment inside the cabinet. Please ensure that the power switch on the power distribution panel is in the “On” position. |
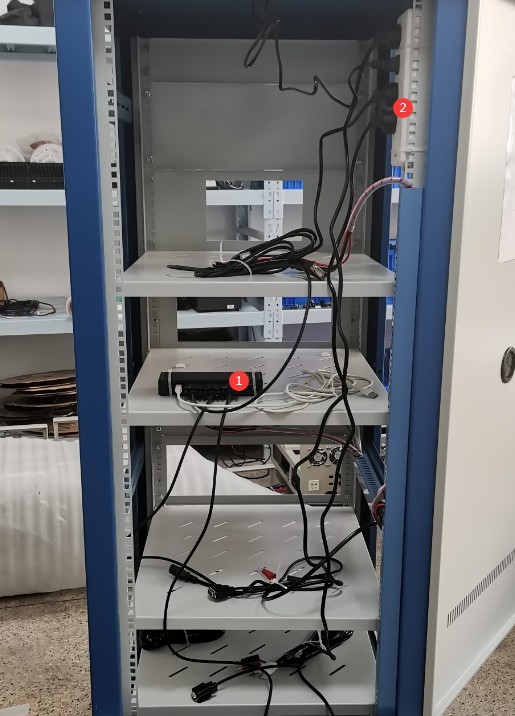
Figure 3-2
Main power cord for the cabinet; see Figure 3-3.
| Number | Note |
| ① | Main power cable for the cabinet, used to supply power to all equipment inside the cabinet |
| ② | Feed it through this cable opening, and connect it to an appropriate power source once the equipment is fully assembled. |
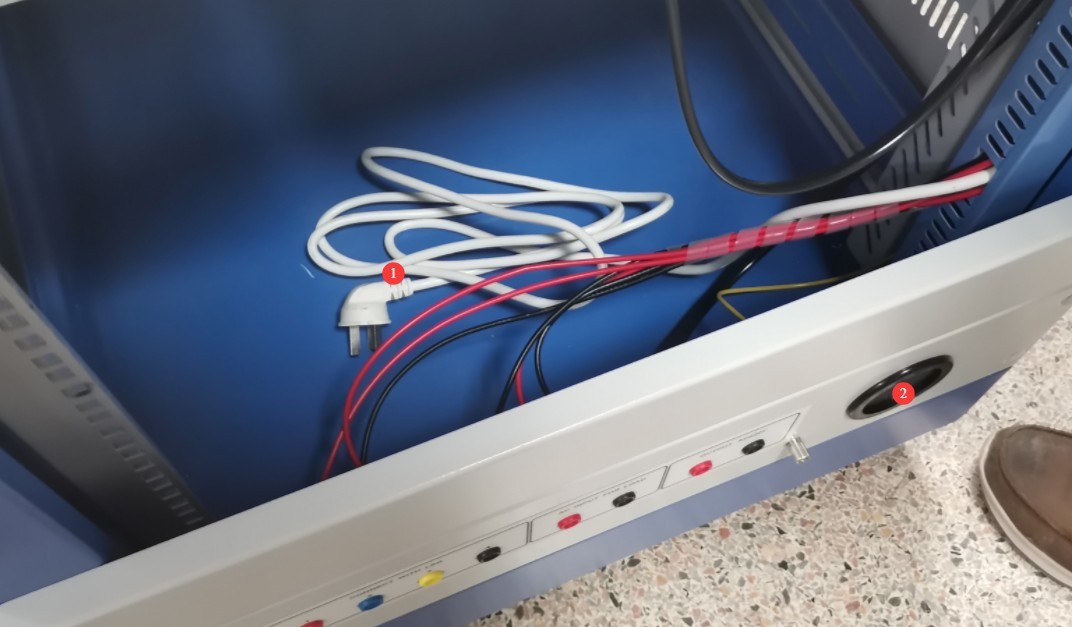
Figure 3-3
3.1.2 Installation of the LS Power Meter
See Figures 3–4.
| Number | Note |
| ① | Connected via an RS-232 communication cable; the other end is connected to the RS-232 communication box inside the cabinet. |
| ② | V1 test lead, connected to the red terminal of the power meter’s voltage V |
| ③ | V2 test lead, connected to the black terminal of the power meter’s V voltage |
| ④ | A1 test lead, connected to the red terminal of the power meter’s current A |
| ⑤ | A2 test lead, connected to the black terminal of the power meter’s current A |
| ⑥ | The power cord is connected; the other end is already connected to the power strip inside the cabinet. |
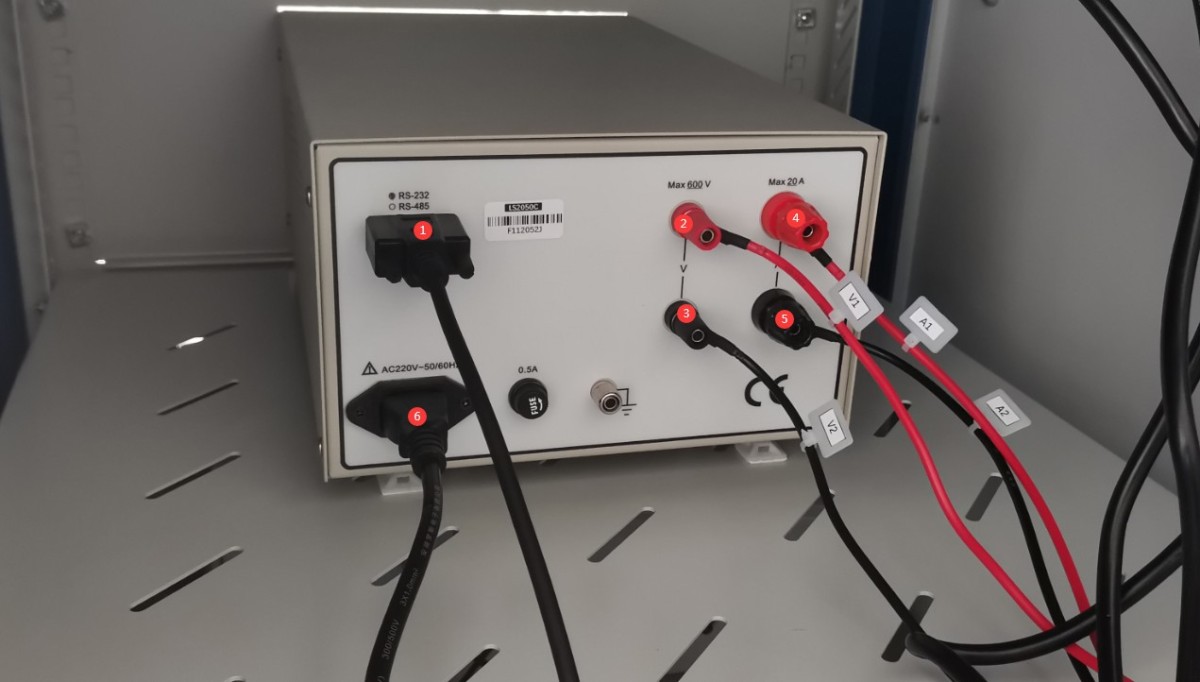
Figure 3-4
3.1.3 Installation of the Spectroradiometer
Spectroradiometer; see Figures 3–5:
| Number | Note |
| ① | USB Cable |
| ② | Luminance Probe |
| ③ | Optical Fiber |
| ④ | Temperature Sensor |
| ⑤ | Power adapter (included with select models only) |
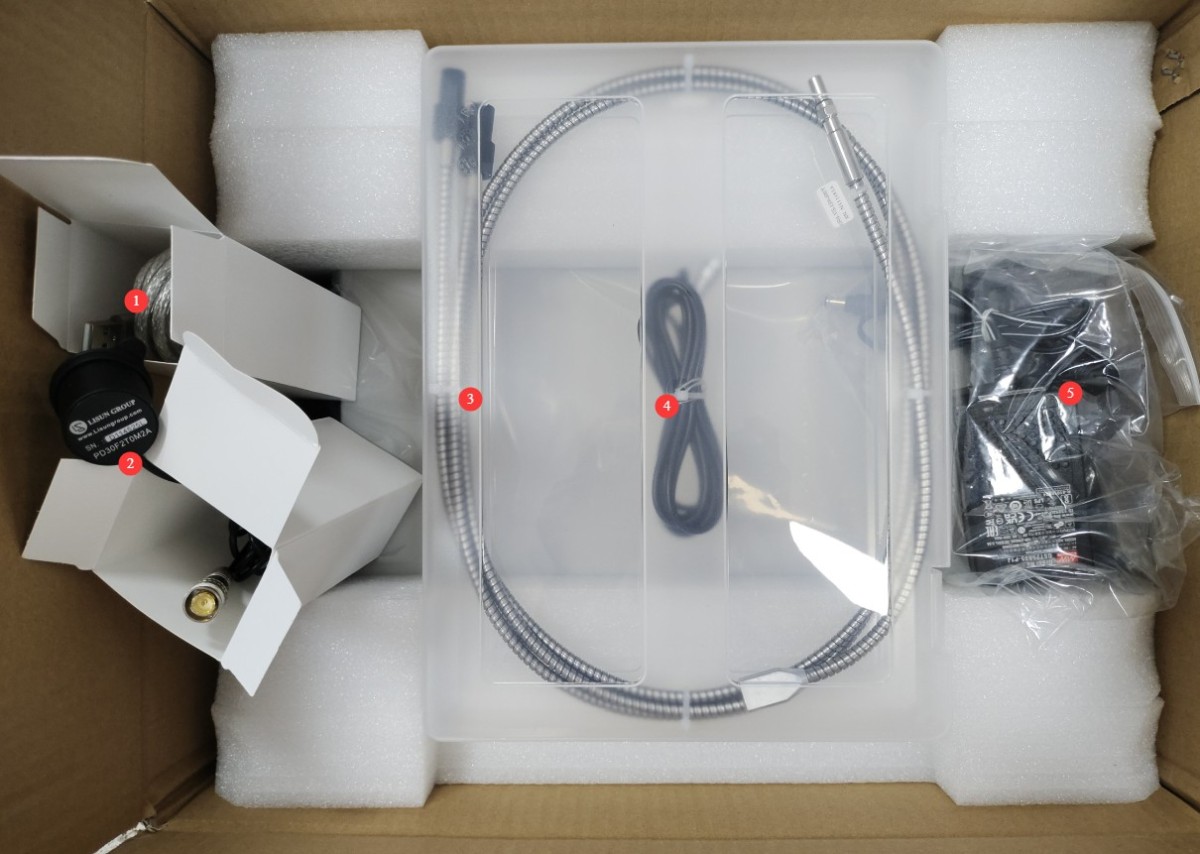
Figure 3-5
To connect Spectroradiometer see Figure 3-6:
| Number | Note |
| ① Optical Fiber | The other end must be connected to Integrating Sphere. If your device includes two Integrating Sphere, use a Y-shaped Optical Fiber splitter to connect to both Integrating Sphere simultaneously. |
| ② Photometric Probe | The probe end must be connected to Integrating Sphere. If your device has two Integrating Sphere, simply connect the probe to Integrating Sphere; Integrating Sphere does not need to be connected to the photometer probe. |
| ③ Temperature Probe | The probe end must be connected to Integrating Sphere. If your device has two Integrating Sphere, simply connect it to Integrating Sphere Integrating Sphere you are using. |
| ④ USB cable | Connect the other end to your computer. Do not use any other USB extension cables or USB adapters, as this may cause Spectroradiometer to malfunction. If you are using a desktop computer, connect it to a black or blue USB port on the back of the computer case. |
| ⑤ Power Jack | The LMS-9000C is powered and communicates via USB, so no power adapter is required. However, if your Spectroradiometer is an LMS-9500C, LMS-9000CUV-VIS, or similar, we will include a 5V power adapter in the package. Please be sure to connect the power adapter here as well. OtherwiseSpectroradiometer will not function properly. |
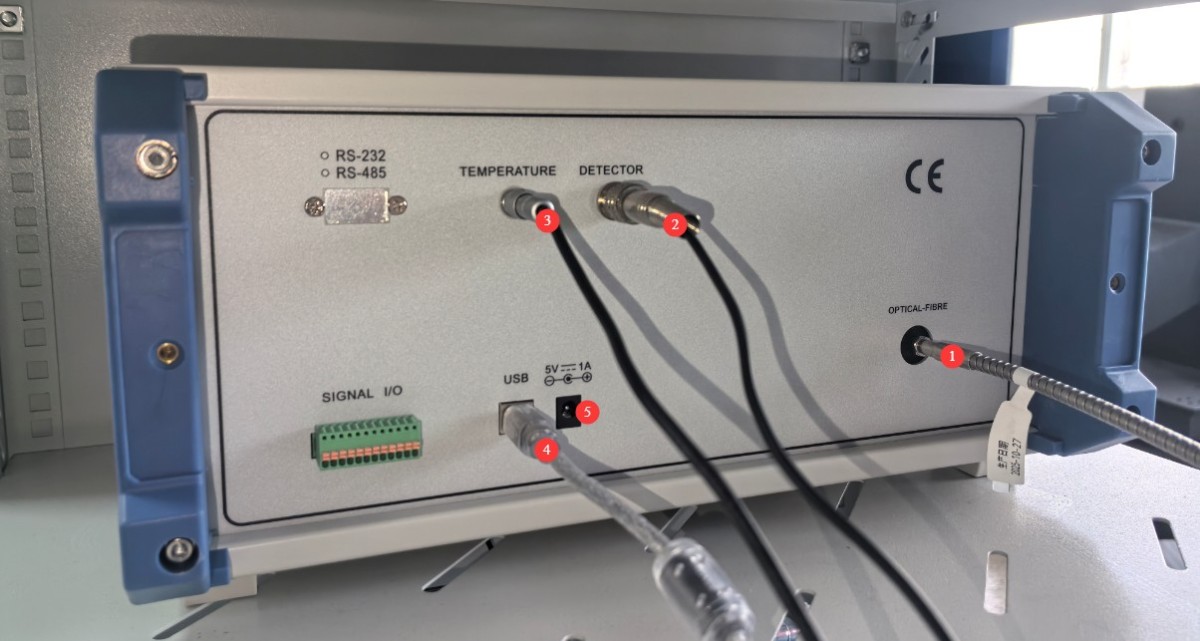
Figure 3-6
3.1.4 DC Power Supply Installation
See Figure 3-7.
| Number | Note |
| ① | Connected via an RS-232 communication cable; the other end is connected to the RS-232 communication box inside the cabinet. |
| ② | Connect the DC power output wires, making sure to match the positive and negative terminals. |
| ③ | The power cord is connected; the other end is already connected to the power strip inside the cabinet. |
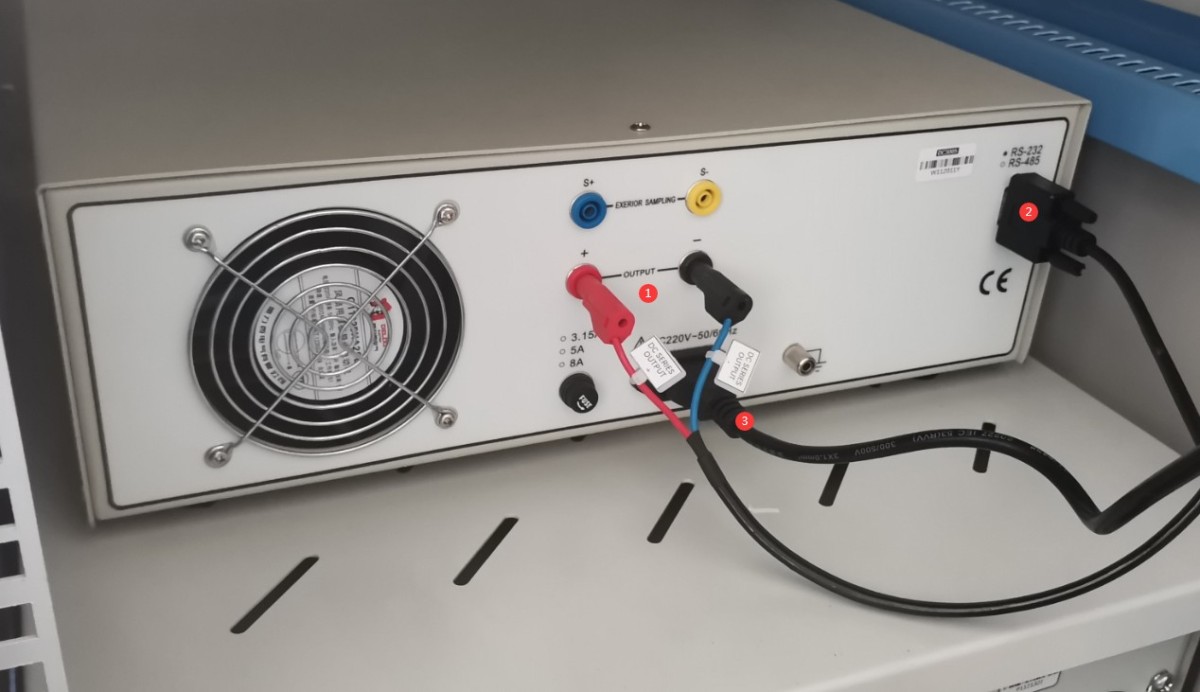
Figure 3-7
3.1.5 AC Power Installation
Please locate the following AC power output cord in the accessories, as shown in Figure 3-8:
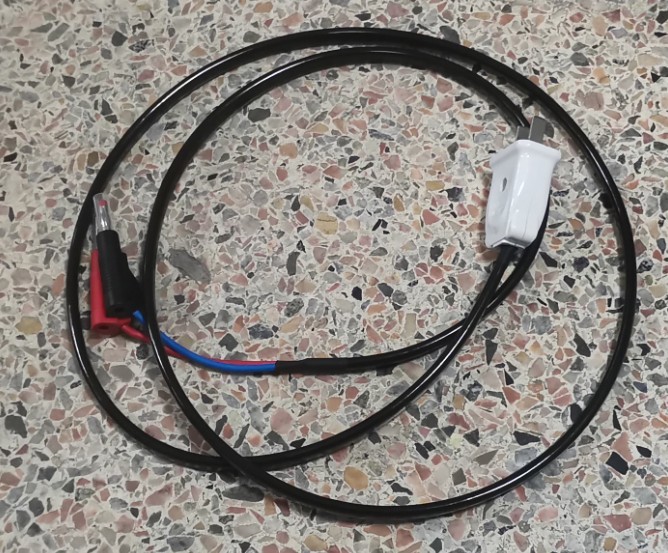
Figure 3-8
AC Power Installation—see Figures 3-9 and 3-10:
| Number | Note |
| ① | Run the AC power output cable through cable opening ④ and connect it to position ⑤. |
| ② | Connected via an RS-232 communication cable; the other end is connected to the RS-232 communication box inside the cabinet. |
| ③ | The power cord is plugged in; the other end is already connected to the power strip inside the cabinet. |
| ④ | Wire hole |
| ⑤ | Run the AC power output cable through cable opening ④ and connect it to position ①. |
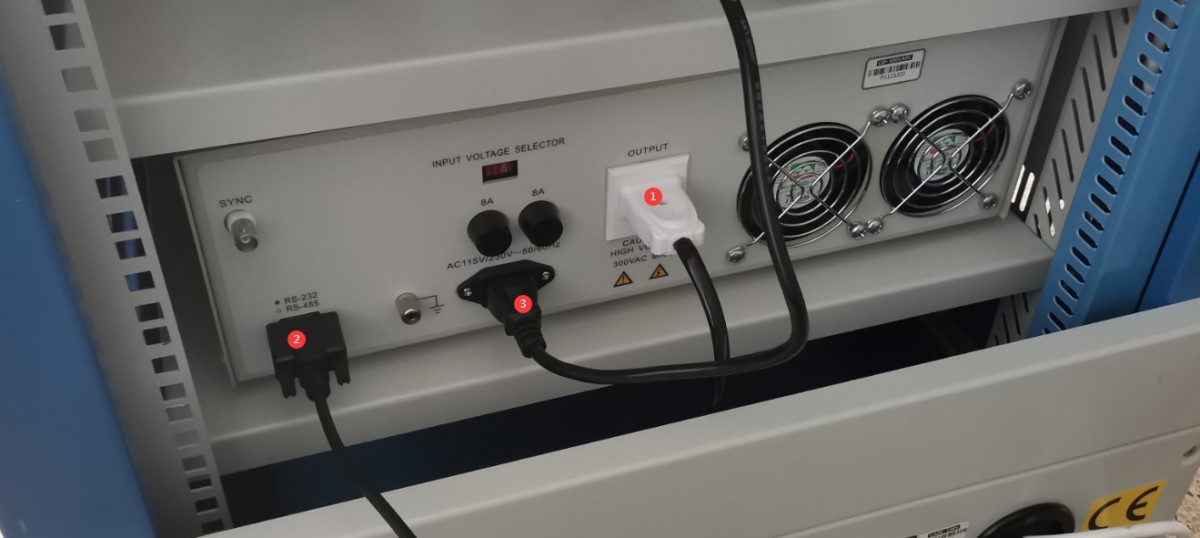
Figure 3-9
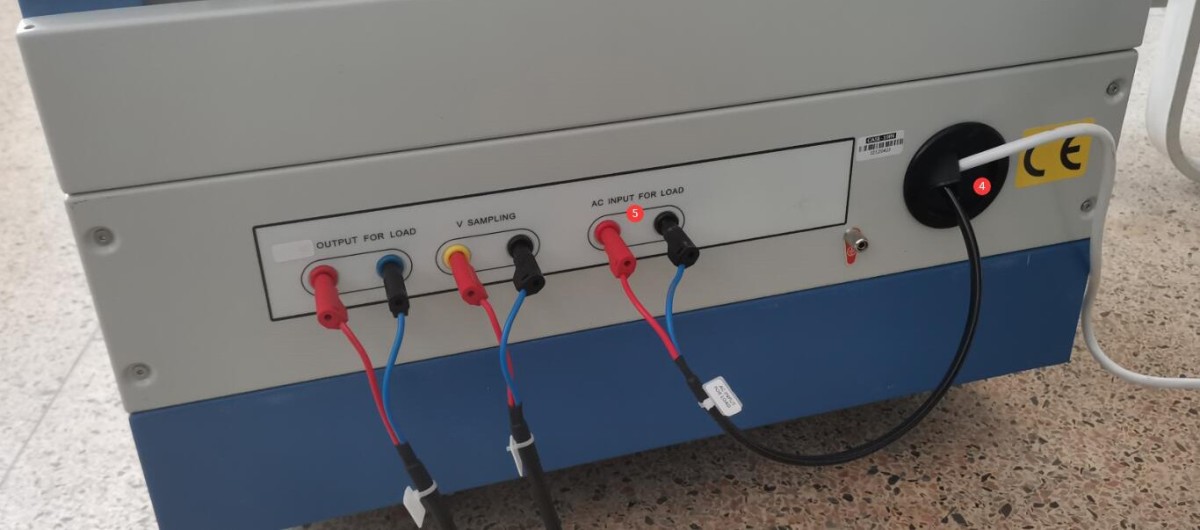
Figure 3-10
3.1.6 Connecting the RS232 Communication Module
See Figure 3-11: Connect the other end of the communication box’s USB cable to the computer. Do not use other USB extension cables or USB adapters, as this may cause communication errors. If using a desktop computer, connect the cable to a black or blue USB port on the back of the computer.
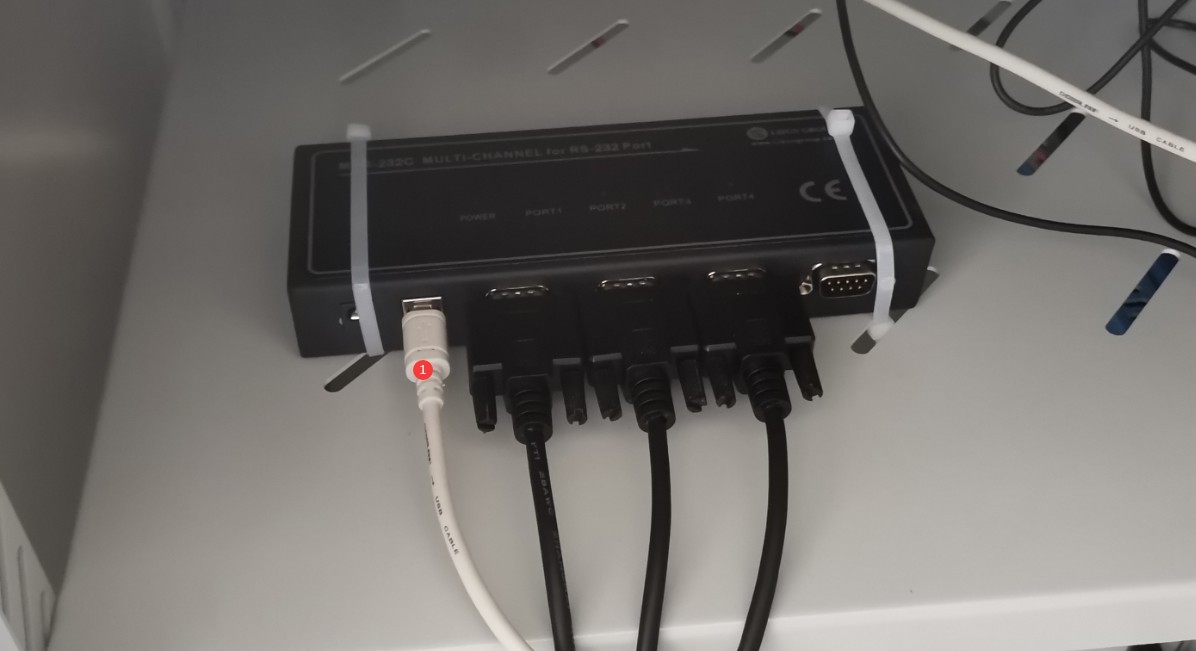
Figure 3-11
3.2 Assembly and Commissioning of Large Integrating Sphere Accessories
3.2.1 Mount Installation and Connection
To prevent Integrating Sphere large Integrating Sphere from opening during shipping, we secure Integrating Sphere with screws. Please remove the two screws securing Integrating Sphere, as shown in Figure 3-12.
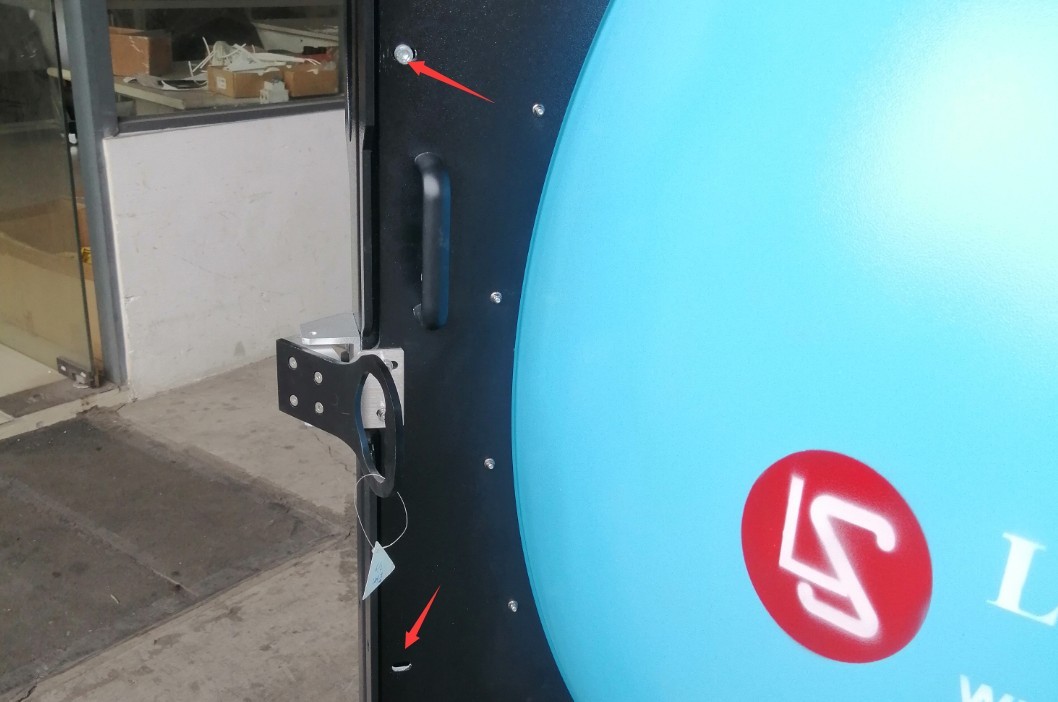
Figure 3-12
The stage can be mounted either on top of Integrating Sphere Integrating Sphere or at the bottom. This section uses the example of mounting the stage at the bottom. Open Integrating Sphere, loosen this screw, and remove the plug, as shown in Figure 3-13.
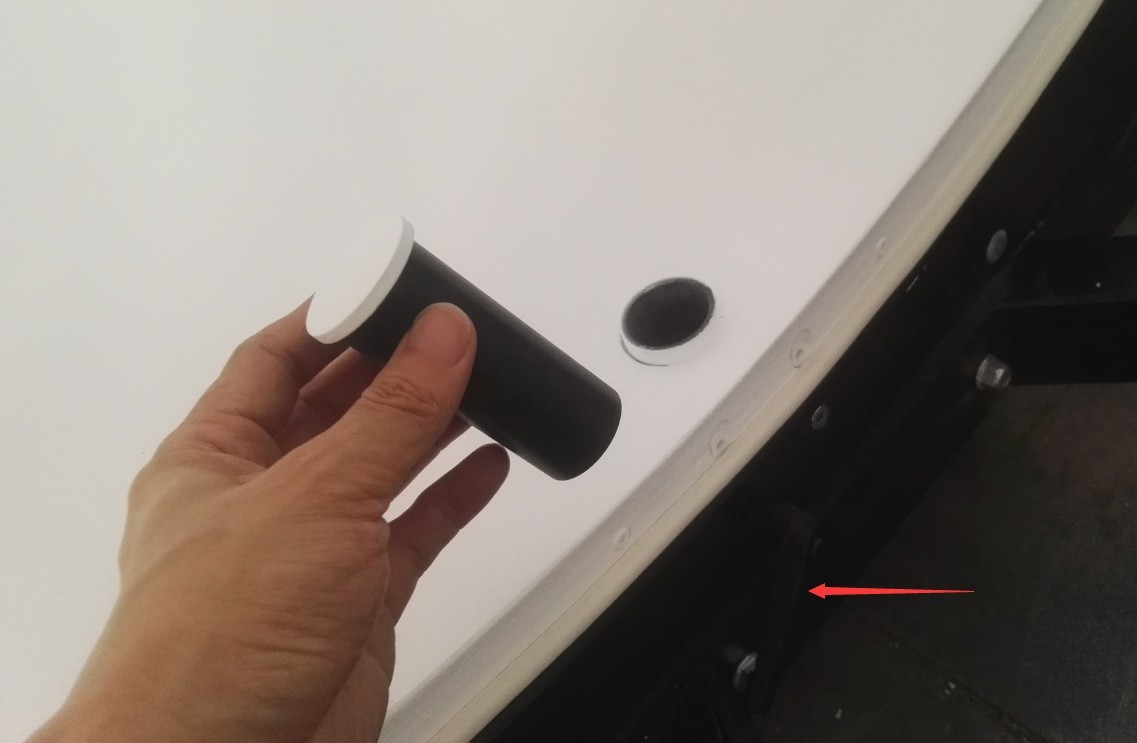
Figure 3-13
Feed the four-core cable from the stage through the opening at the bottom of Integrating Sphere, as shown in Figure 3-14.
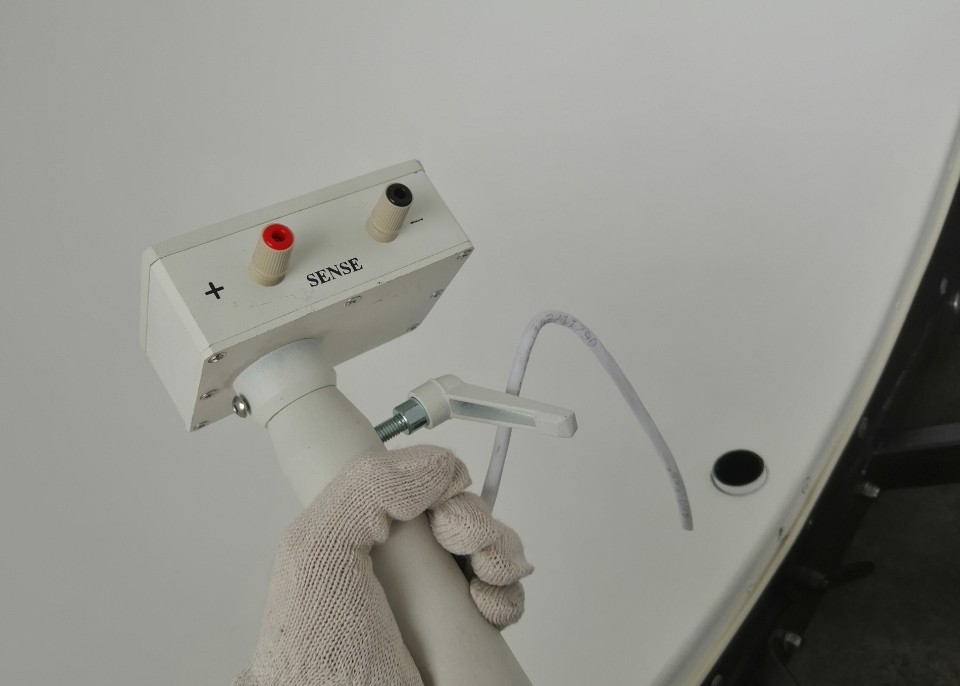
Figure 3-14
Refer to Figure 3-15, then retighten this screw, making sure the screw handle is facing down.
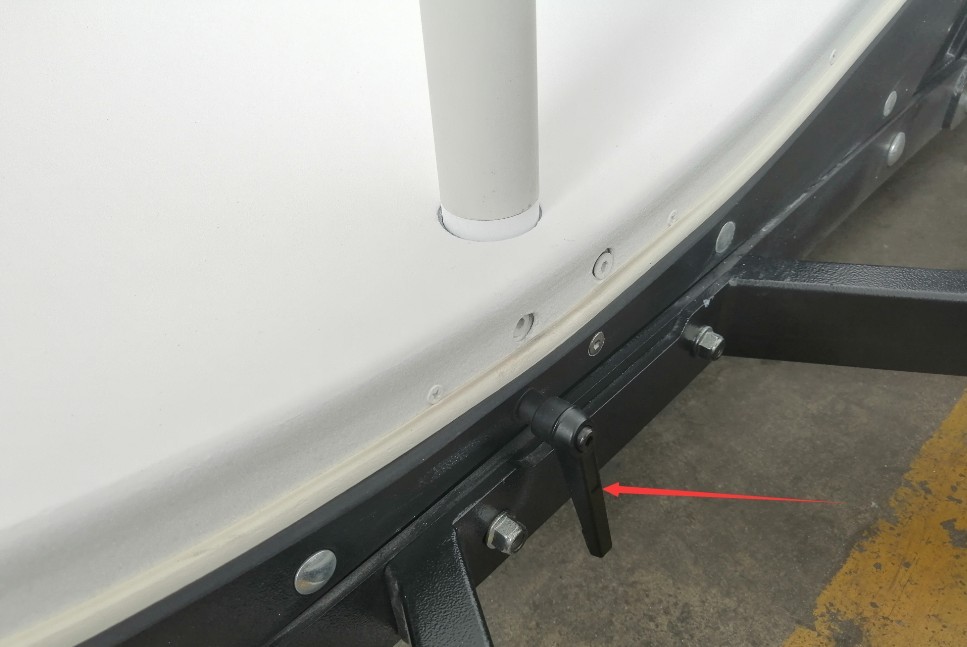
Figure 3-15
Connect the junction box as shown in Figures 3-16 and 3-17.
| Number | Note |
| ① | Connect the four-wire cable from the stage to the back of the junction box at the base of Integrating Sphere large Integrating Sphere. The four terminals on the junction box—POWER and SENSE—must be connected one-to-one with the four terminals on the stage—POWER and SENSE. You can open the stage and the junction box to verify this. |
| ② | Connect the two “POWER” terminals on the Integrating Sphere junction box to the “OUTPUT FOR LOAD” terminals on the cabinet. |
| ③ | Connect the two terminals on the Integrating Sphere junction box (SENSE) to the cabinet’s V SAMPLING port. |
| ④ | Connect the two “OUTPUT FOR LOAD” terminals on the cabinet to the “POWER” terminal on the Integrating Sphere junction box. |
| ⑤ | Connect the two “V SAMPLING” terminals on the cabinet to the “SENSE” terminal on the Integrating Sphere junction box. |
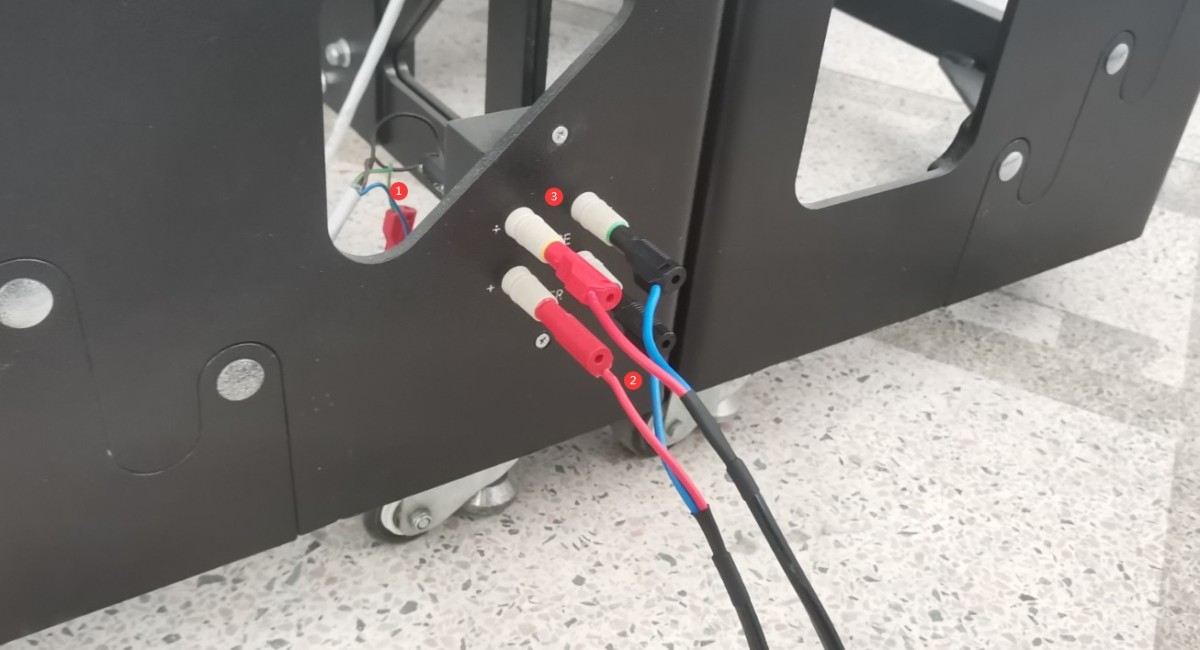
Figure 3-16
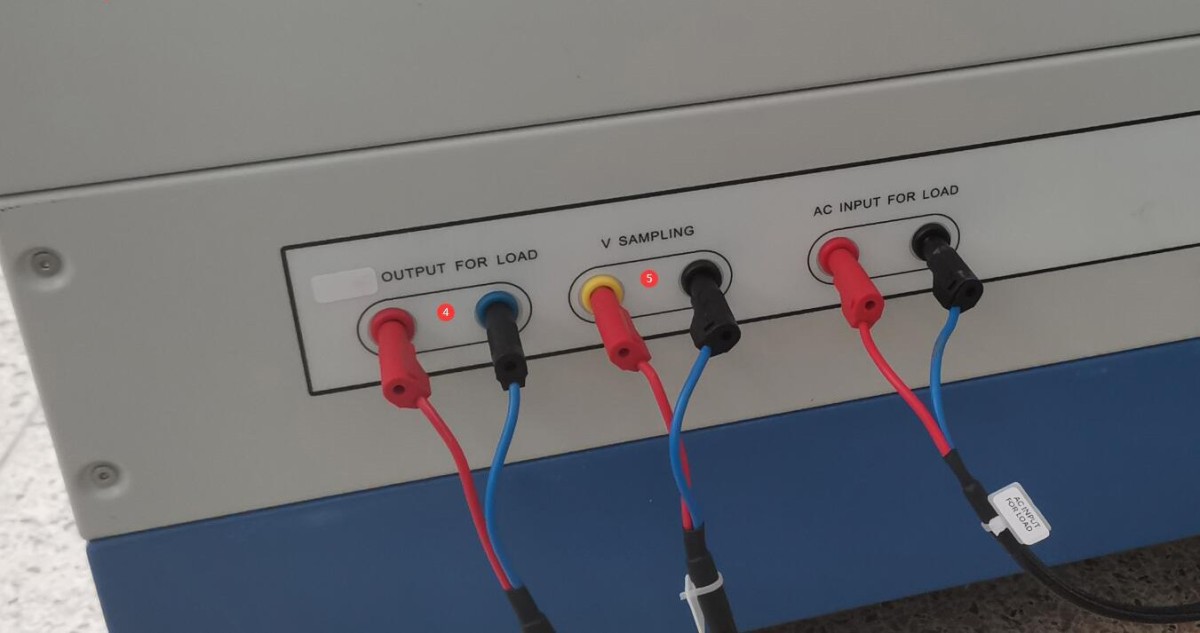
Figure 3-17
Note: If your device includes two Integrating SphèresIntegrating Sphere when Integrating Sphere the smaller Integrating Sphere, Integrating Sphere Integrating Sphere four-wire cable from the cabinet to the larger Integrating Sphere to the smaller Integrating Sphere.
3.2.2 Connecting Spectroradiometer Accessories
See Figure 3-18.
| Number | Note |
| ① | Optical Fiber |
| ② | Luminance Probe |
| ③ | Temperature Probe |
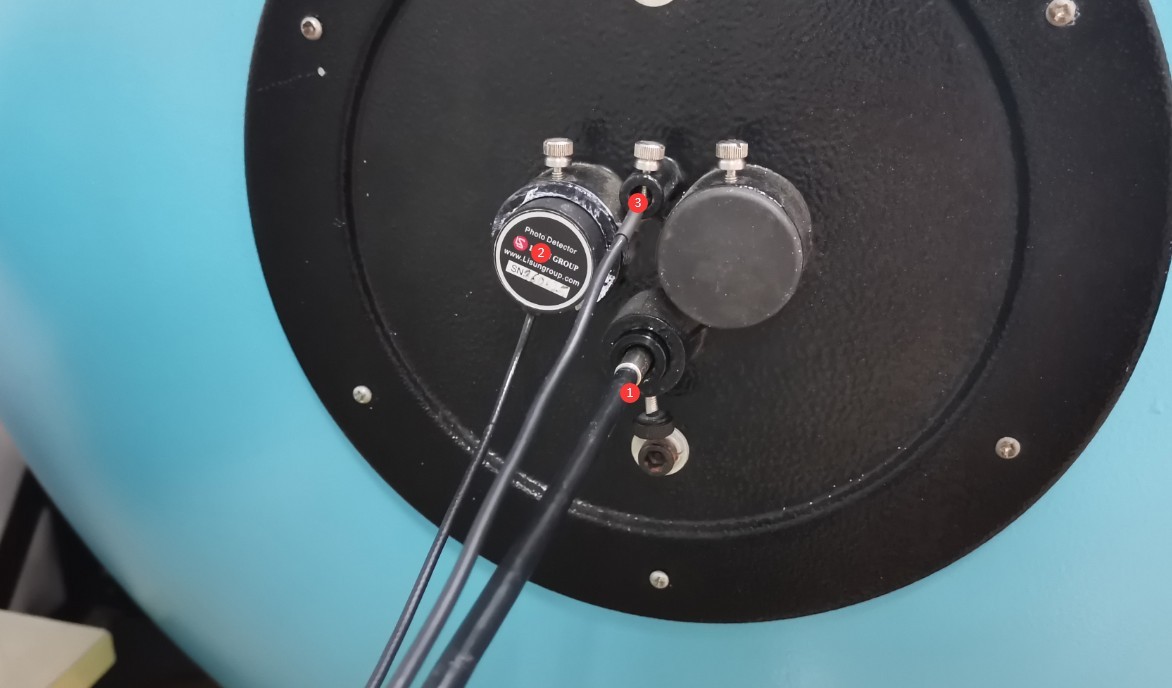
Figure 3-18
Note: If your device includes two Integrating Sphere, connect the other end of Optical Fiber Y-shaped Optical Fiber to Integrating Sphere smaller Integrating Sphere.
3.2.3 Cross-Laser Calibration
Integrating Sphere contains a cross-shaped laser, as shown in Figure 3-19.
| Number | Note |
| ① | Battery compartment, used to power the cross-line laser |
| ② | Cross-Line Laser Switch |
| ③ | Cross-hair laser and its mounting screws |
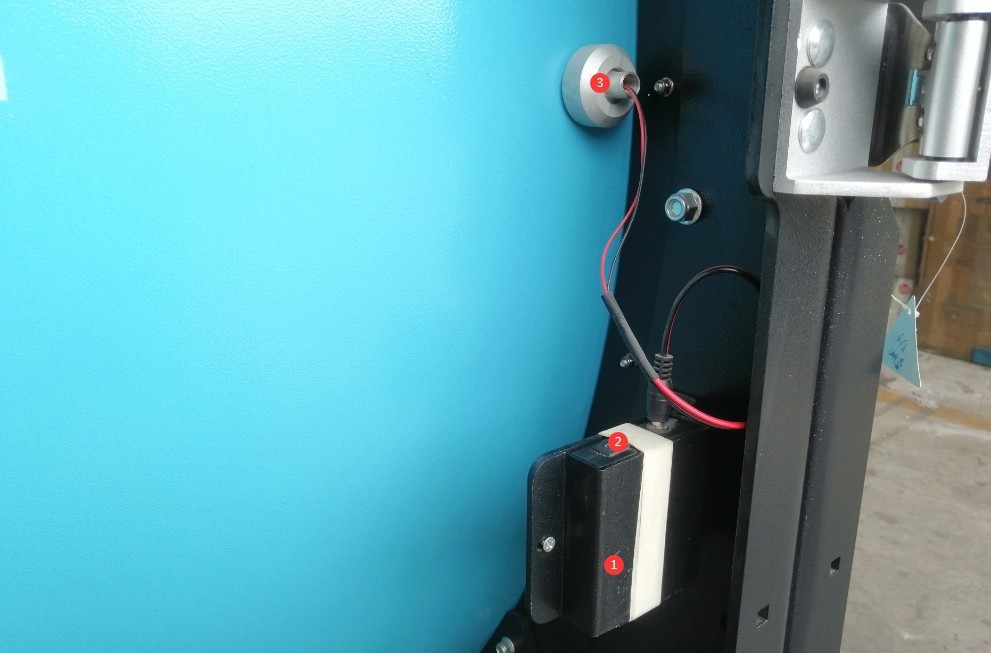
Figure 3-19
Turn on the crosshair laser. The crosshair laser may have become misaligned during shipping. Use a tape measure to confirm the center position of Integrating Sphere, loosen the screw securing the crosshair laser, reposition the crosshair laser so that it is exactly centered on Integrating Sphere, and then tighten the screw securely.
3.3 Power On and Off Procedures
Connect the cabinet power cord to a 220 V, 50/60 Hz power source, as shown in Figure 3-20.
| Number | Note |
| ① | Cabinet Power Switch |
| ② | Internal sampling/external sampling, voltage sampling methods. Internal sampling is the older, three-wire sampling method specified in the old standard, while external sampling is the newer, four-wire sampling method specified in the new standard. Simply switch to external sampling; there is no need to use internal sampling. |
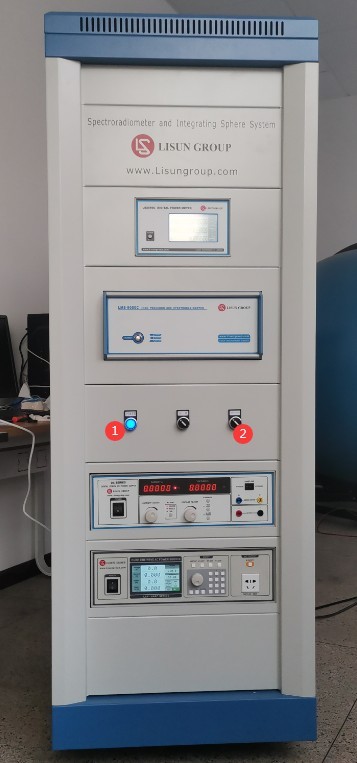
Figure 3-20
Power-up sequence: First, turn on the cabinet’s main power switch, then turn on the power switches for each piece of equipment inside the cabinet one by one.
Shutdown procedure: First, turn off the power switches for each piece of equipment in the cabinet one by one, then turn off the cabinet’s main power switch.
4. Software Installation and Configuration
4.1 Software and Driver Installation
4.1.1 Software Runtime Environment
System Requirements: Windows 7/8/10/11 (32-bit/64-bit); the computer must have at least two USB ports.
Note: If you have purchased multiple LMS-9000 units, please connect them to different computers whenever possible and avoid mixing them, as doing so may cause the software to display incorrect data.
4.1.2 Installation
See Figure 4-1.
| Number | Note |
| ① | LMS-9000 software—please double-click to install |
| ② | LMS-9000 Driver—please double-click to install |
| ③ | RS232 Communication Box Driver—please double-click to install |
| ④ | Windows Plug-in: If you encounter an error message from the Windows operating system while installing the LMS-9000 software, you may need to install this plug-in. |

Figure 4-1
4.1.3 Exception Handling
If your antivirus software or Windows Firewall flags a file as suspicious during the software installation process, please temporarily disable the antivirus software or Windows Firewall and then try installing the software again.
If the software fails to open when you double-click the icon after a successful installation, please check whether you are logged in to your computer with an administrator account. If the software still does not open after logging in with an administrator account, right-click the software icon to open its Properties window. On the Compatibility tab, check the box next to “Run this program as an administrator,” click “Apply,” and then double-click the icon again to open the software, as shown in Figure 4-2.
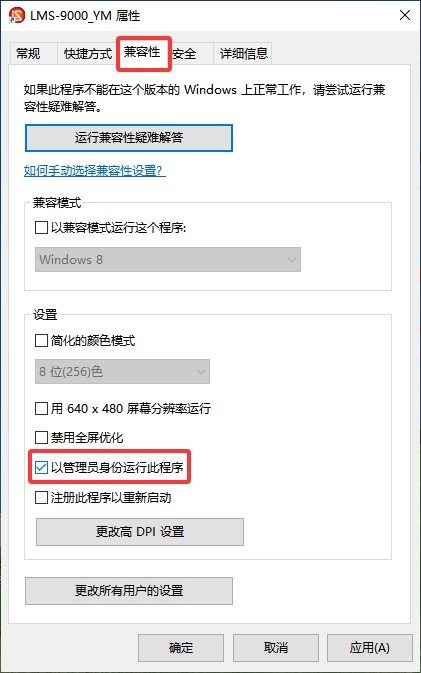
Figure 4-2
4.1.4 View the Device Manager on Your Computer
Open “Device Manager” on your computer (see Figure 4-3). You should find “LMS-9000” and four additional communication ports in the following location (Note: Port numbers may vary depending on the computer and USB port used), and verify that there are no error messages. If any abnormalities are found, please refer to sections 4.1.2 and 4.1.3 for troubleshooting and verification.
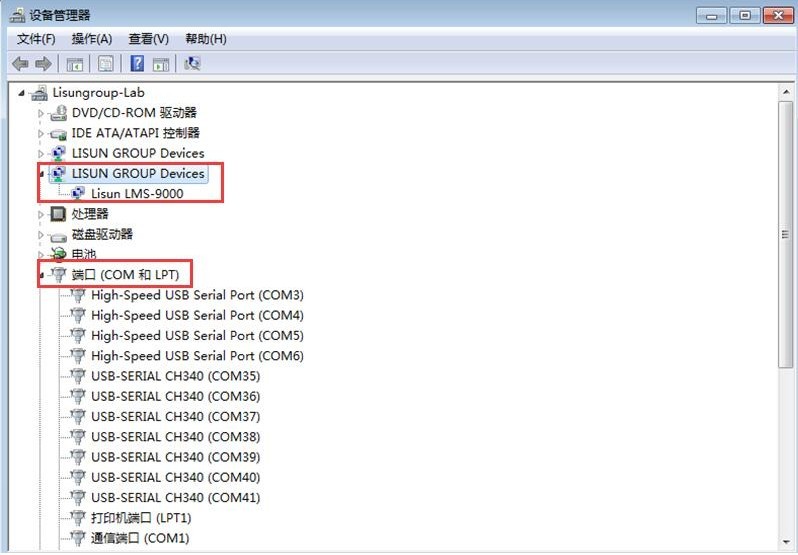
Figure 4-3
Note: If your device does not include an RS232 communication module, the four additional communication ports mentioned above will not appear in the computer’s “Device Manager.”
4.2 Software Settings
4.2.1 Opening the Software
When you open the software for the first time, you will be prompted to create a new database file (in .lms format), as shown in Figure 4-4. Subsequent test reports will be automatically saved in this database file. Please enter a file name, select an appropriate path, and click “Save.”
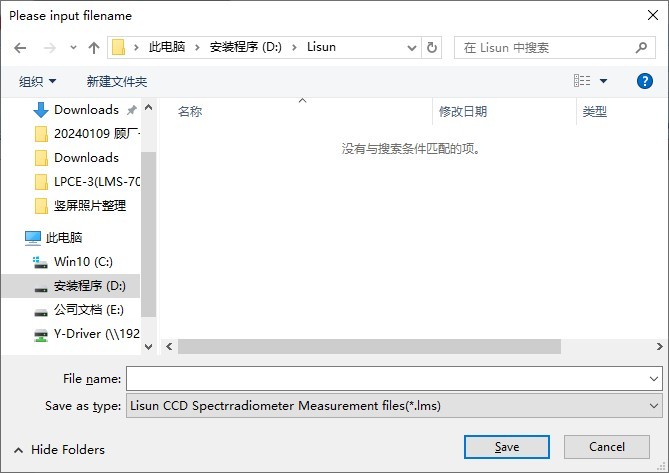
Figure 4-4
Note 1: The LMS-9000 can be installed on any computer; however, the software will not function unless the computer is communicating with the LMS-9000 device.
Note 2: Database files generated by the LMS-9000 software can only be opened using the LMS-9000 software.
Note 3: Please avoid placing database files on your computer’s desktop whenever possible, as this may cause errors when reading or writing data.
4.2.2 Adding Large and Small Integrating Sphere
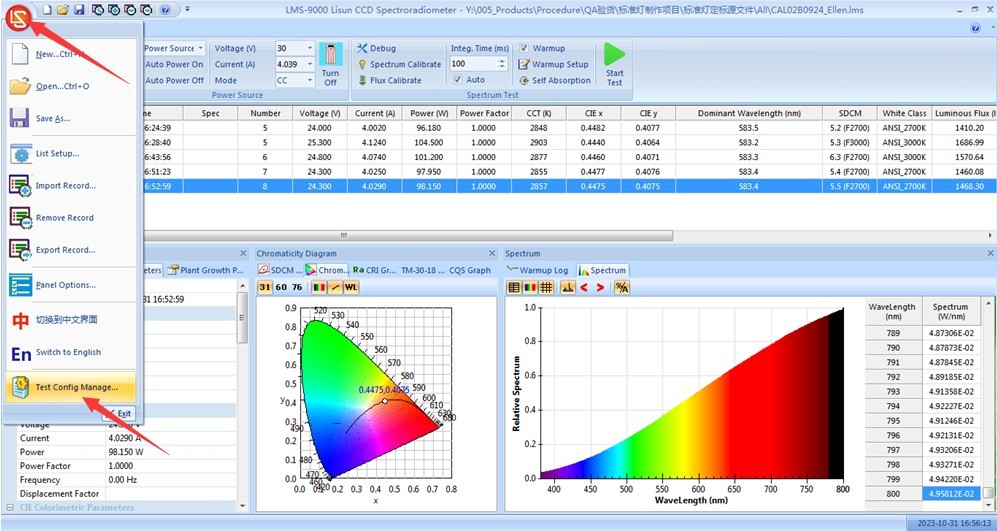
If your system includes two Integrating Sphere, click “Add Large Sphere” and “Add Small Sphere” at the locations shown in the figure below (see Figures 4-5).
Figures 4–5
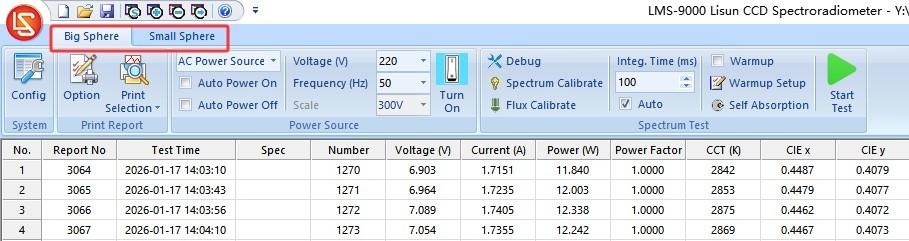
When you modify or add the corresponding test options, they will be displayed as tabs in the location shown in the figure below (see Figure 4-6):
Figures 4–6
All software operations—including system configuration, calibration, testing, and the generation and use of auxiliary light coefficients—must be performed under the corresponding test configuration tab.
4.2.3 System Configuration
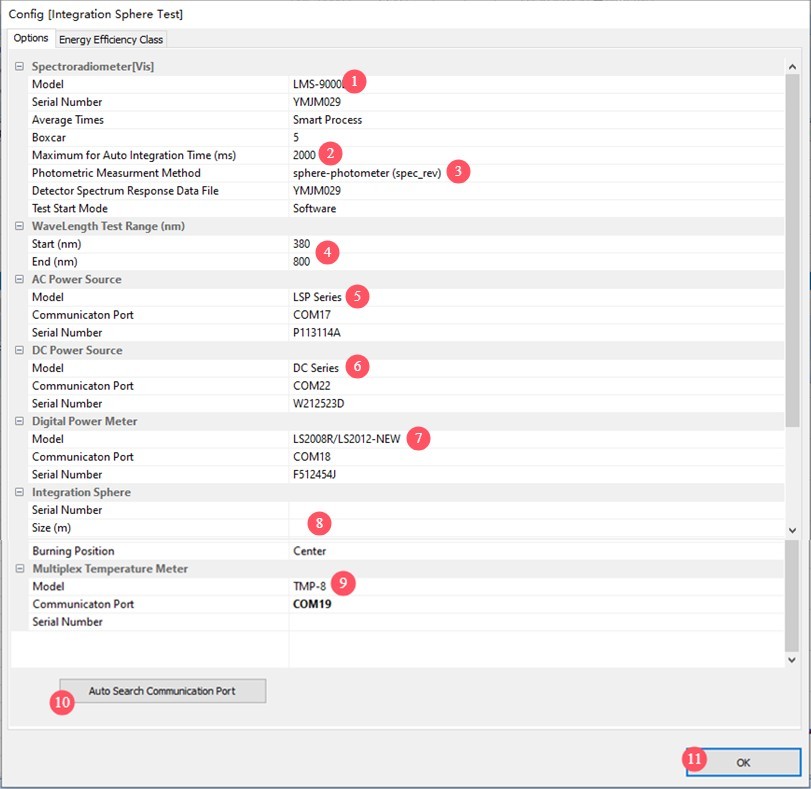
Take Integrating Sphere as an example. Select the “Large Integrating Sphere Sphere” tab and click “System Configuration,” as shown in Figure 4-7.
| Number | Note |
| ① | Spectroradiometer models and related information; the software can retrieve this information automatically |
| ② | The default maximum integration time is 2000 milliseconds. The LMS-9500C is a refrigerated model that can still produce accurate test reports even when light signals are very faint. However, longer integration times are required in such situations. If you are using the LMS-9500C Spectroradiometer, you can increase the integration time to, for example, 10000 milliseconds to facilitate testing in low-light conditions. |
| ③ | Click the drop-down list to select the photometric parameter measurement method. As mentioned above, Spectroradiometer is connected to the Integrating Sphere Sphere via an Optical Fiber a photometric probe. If you have two Integrating Sphere and the Integrating Sphere is connected via Optical Fiber, you should select “Spectroradiometric Method”; if only Integrating Sphere smaller Integrating Sphere is connected via Optical Fiber you should select “Spectrometric Method.” |
| ④ | Wavelength measurement range settings: The default range is 380 to 800 nm. If the wavelength range of Spectroradiometer you purchased is different, please adjust the settings here directly. |
| ⑤ | Click the drop-down list to select the model of the AC power supply you purchased (usually the LSP Series). If you did not purchase an LISUN AC power supply, please select “Not Installed”; otherwise, a communication error will occur. |
| ⑥ | Click the drop-down list to select the model of the DC power supply you purchased (usually the DC Series). If you did not purchase a LISUN DC power supply, please select “Not Installed”; otherwise, a communication error will occur. |
| ⑦ | Click the drop-down list to select the model of the power meter you purchased; you can find the model number on the power meter’s front panel. Please select the correct model you purchased. If you did not purchase a LISUN power meter, please select “Not Installed”; otherwise, a communication error will occur. |
| ⑧ | Enter the dimensions Integrating Sphere. This information appears only in the test report and does not affect the actual test results. |
| ⑨ | If you have purchased a TMP-8 Multiplex Temperature Tester to use with Spectroradiometer, click the drop-down list to select the corresponding Multiplex Temperature Tester model. Once communication is established, Spectroradiometer may display the temperatures measured by Multiplex Temperature Tester in the test report as well. |
| ⑩ | Click “Auto-Search Ports.” If a message indicates a communication error with a device, follow the on-screen instructions to verify that the correct model has been selected, that the communication cable is connected, and that the device is powered on. |
| ⑪ | Once all settings and communication are configured, simply click OK to save. |
Figures 4–7
Note 1: Switch the software interface to “Small Integrating Sphere Sphere” and configure all settings using the same method.
Note 2: Reinstalling the software or unplugging and replugging the USB cable will require re-establishing communication.
5. Calibration
5.1 Calibration Principles
| Description of the Situation | Is recalibration necessary? |
| First Use | Calibration is required before use. |
| The equipment needs to be used every week. | We recommend calibrating once a week. |
| Equipment that has not been used for more than a week | Calibration is required before the next use. |
| Reinstall the software | No recalibration required |
| Replace the computer | Needs to be recalibrated |
| Plugging in and unplugging the USB cable | No recalibration required |
| Inserting and Removing the Optical Fiber Probe on the Spectrometer End | |
| Inserting and Removing the Optical Fiber Probe from Integrating Sphere | It is recommended to recalibrate. |
| Significant changes in environmental conditions, such as temperature and humidity | |
| The software has added Integrating Sphere and Integrating Sphere | Calibration must be performed separately, and the calibration data for the Integrating Sphere does not affect the calibration data for the Integrating Sphere; each must follow the principles outlined above. |
5.2 Calibration Procedure for Integrating Sphere
Take Integrating Sphere large Integrating Sphere as an example. Refer to Section 3.2.1 to connect the two two-conductor cables from the cabinet—a total of four cables—to the large Integrating Sphere junction box.
All of our standard lamps are constant-current DC light sources. Please set the AC/DC switch on the cabinet to DC, as shown in Figure 5-1.
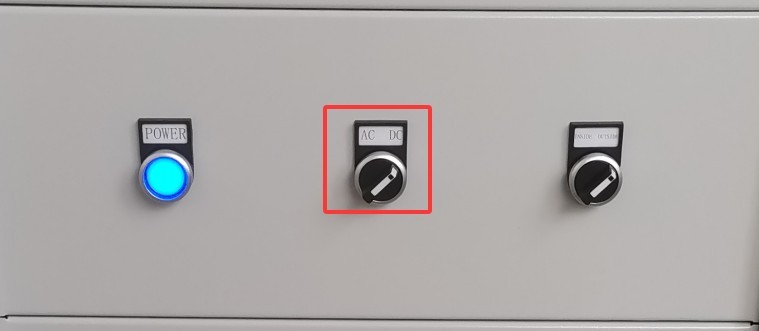
Figure 5-1
Please remove the appropriate standard bulb, put on white gloves, and carefully install it into the E27 socket on the stand. Turn on the crosshair laser to ensure the bulb is centered on the sphere, as shown in Figure 5-2.
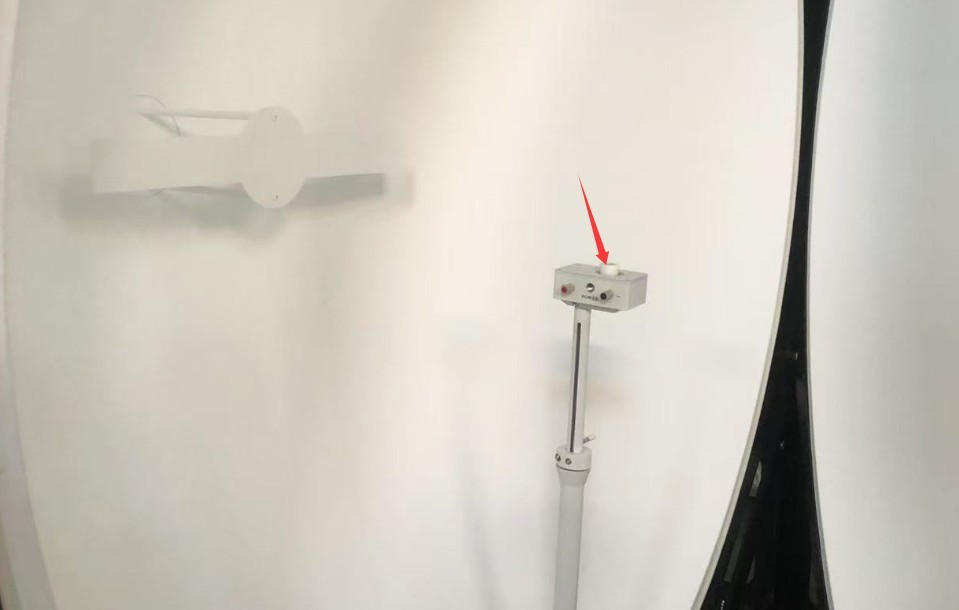
Figure 5-2
Then turn off the crosshair laser and Integrating Sphere. If your device has two Integrating Sphere, make Integrating Sphere both are turned off (Optical Fiber reads signals from Integrating Sphere simultaneously).
Switch the software to “Large Integrating Sphere,” then click “Spectral Calibration,” as shown in Figure 5-3.
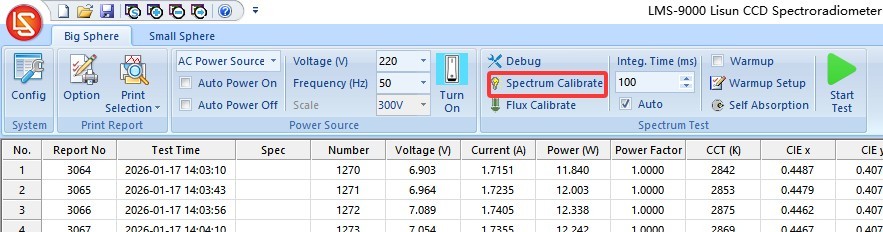
Figure 5-3
If your software is already communicating properly with the LISUN DC power supply, please refer to Section 5.2.1 to continue; if your software is not communicating with the LISUN DC power supply, please refer to Section 5.2.2 to continue.
5.2.1 The software is communicating properly with the LISUN DC power supply
If you have purchased a LISUN DC power supply and have successfully established communication with it in “System Configuration,” please follow the instructions in the table and diagram below, as shown in Figure 5-4.
| Number | Note |
| ① | The device automatically displays the DC power supply model and communication port, eliminating the need to select or search for the port again. |
| ② | To make the process more convenient, please check the “Auto-On” and “Auto-Off” options. |
| ③ | The corresponding current and voltage values are listed on the standard lamp certificate and the standard lamp packaging box; please enter them correctly. Note: The specifications vary by lamp, so please do not mix and match them. |
| ④ | Click to control the DC power supply output and verify that the test lamp illuminates properly. When the test lamp is lit normally, the DC power supply should display “CC” (constant current output), and the displayed current value should match the input value exactly; the displayed voltage will fluctuate around 25V. If the displayed current does not match the entered value (fluctuations in the last digit after the decimal point are normal) or if the displayed voltage differs significantly (for example, only around 10 V), the standard lamp is not lighting up properly. Please check the standard lamp’s filament, its installation, and all wiring, then try again. |
| ⑤ | The color temperature and luminous flux are listed on the standard lamp certificate and the standard lamp packaging. Please enter them correctly. Note: The specifications vary by lamp; please do not mix them. |
| ⑥ | For points accumulation, be sure to check the “Auto” box. |
| ⑦ | Average count; the default is 10; no changes are needed. |
| ⑧ | The warm-up time is set to 15 minutes by default; no changes are necessary. In other words, after clicking “Start,” the software will wait 15 minutes for the standard lamp to warm up, and once the data has stabilized, it will automatically perform calibration. |
| ⑨ | Once you have confirmed that the above settings are correct, click “Start.” The software will automatically perform the following steps in this order: automatically control the DC power supply to turn on the standard lamp; start the warm-up countdown; automatically perform calibration when the warm-up countdown ends; and, after successful calibration, automatically control the DC power supply to turn off the standard lamp. |
| Note | In the calibration interface, do not perform any actions on the sections not listed in this table! |
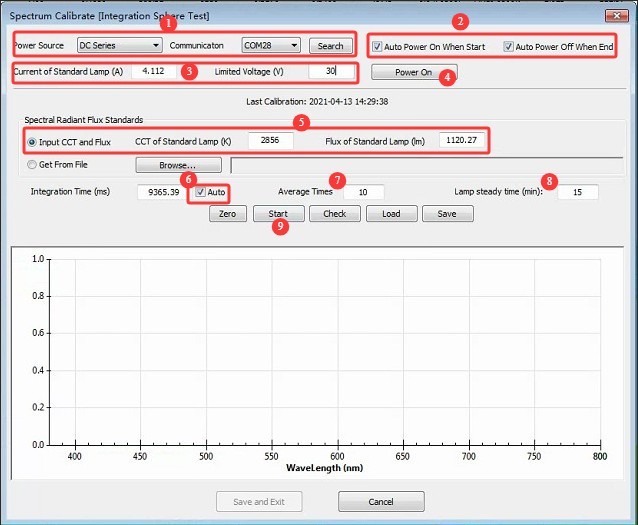
Figure 5-4
After successful calibration, the following interface will appear, as shown in Figure 5-5.
| Number | Note |
| ① | Check whether the color temperature and luminous flux displayed here match or are close to the set values. A difference of 1 to 2 K in color temperature and 1 to 2 lumens in luminous flux is considered normal. |
| ② | Click “Save and Exit” to complete the calibration. |
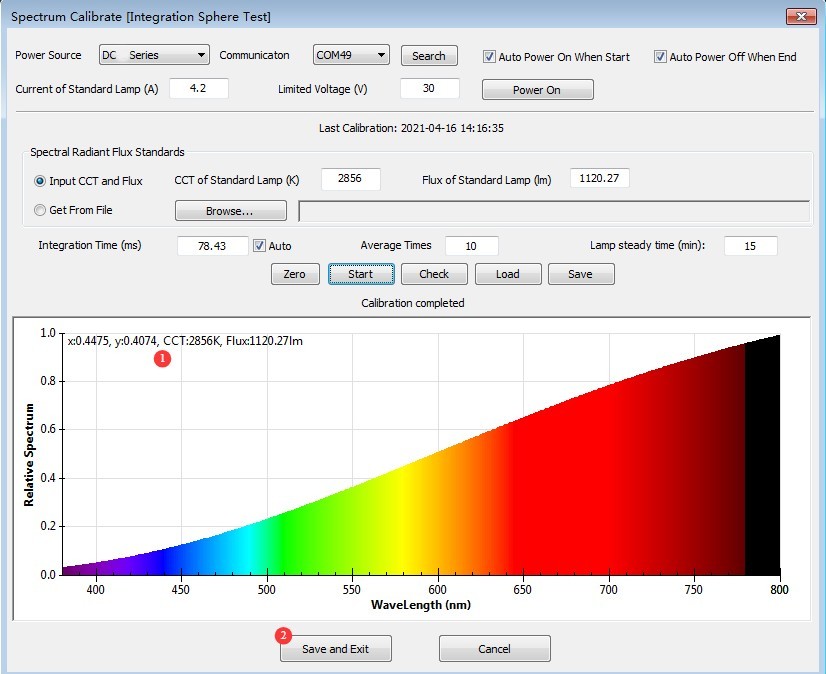
Figure 5-5
The standard lamp will be hot immediately after use. Wait until it has cooled to room temperature, then carefully remove it while wearing white gloves (do not touch the bulb to prevent contamination), and return it to its case for proper storage.
5.2.2 The software is not communicating with the LISUN DC power supply
If you have not purchased a LISUN DC power supply, or if you were unable to establish communication with it in “System Configuration,” please refer to the following table and illustrations for instructions; see Figures 5–6.
| Number | Note |
| ① | Do not check the “Auto On” or “Auto Off” options. Do not enter standard lamp current or voltage parameters, and do not click to control the DC power supply output; otherwise, the software will display an error message. |
| ② | The color temperature and luminous flux are listed on the standard lamp certificate and the standard lamp packaging; please enter them correctly. Note: The specifications vary by lamp; do not mix them. |
| ③ | For points accumulation, be sure to check the “Auto” box. |
| ④ | Average count; the default is 10; no modification is necessary. |
| ⑤ | The warm-up time is set to 15 minutes by default and does not need to be changed. In other words, after you click “Start,” the software will wait 15 minutes for the standard lamp to warm up, and once its data has stabilized, it will automatically perform calibration. |
| ⑥ | Once you have confirmed that the above operations and settings are correct, manually operate your DC power supply. Refer to the corresponding current value listed on the standard lamp certificate and the standard lamp packaging to ensure constant-current output and turn on the standard lamp. When the standard lamp is lit normally, the DC power supply should display “CC,” indicating constant current output, and the displayed current value should match the entered value exactly. The displayed voltage will fluctuate around 25V. If the displayed current does not match the entered value (fluctuations in the last digit after the decimal point are normal) or the displayed voltage differs significantly (e.g., only around 10V), the standard lamp is not lit properly. Please check the standard lamp’s filament, installation, and all wiring, then try again. Once the standard lamp is lit normally, click “Start.” The software will automatically enter the warm-up countdown. When the warm-up countdown ends, calibration will begin automatically. After calibration is successful, please manually turn off the standard lamp using the DC power supply. |
| Note | In the calibration interface, do not perform any actions on the sections not listed in this table! |
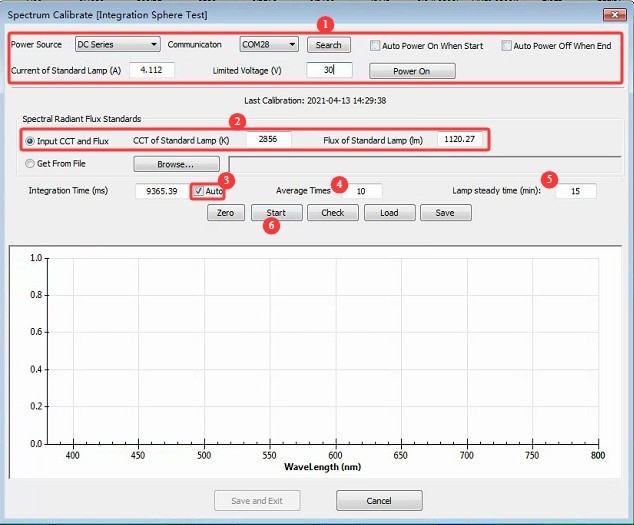
Figures 5–6
After successful calibration, the following interface will appear, as shown in Figure 5-7.
| Number | Note |
| ① | Check whether the color temperature and luminous flux displayed here are close to the set values. A difference of 1 to 2 K in color temperature and 1 to 2 lumens in luminous flux is considered normal. |
| ② | Click “Save and Exit” to complete the calibration. |
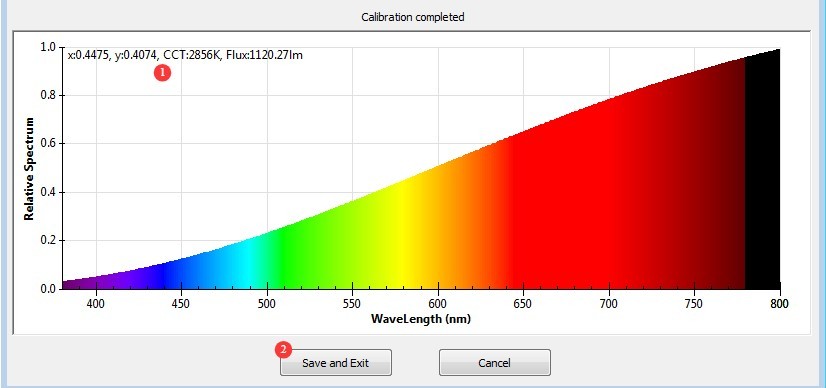
Figure 5-7
The standard lamp will be hot immediately after use. Wait until it has cooled to room temperature, then carefully remove it while wearing white gloves (avoid touching the bulb to prevent contamination), and place it back in the lamp case for proper storage.
5.3 Procedure for Calibrating Integrating Sphere Small Integrating Sphere
Refer to Section 3.2.1 to connect the two two-conductor cables from the cabinet—a total of four cables—to the small Integrating Sphere junction box.
Set the software to “Small Integrating Sphere.”
Install the standard bulb. Note: Integrating Sphere 0.3-meter Integrating Sphere does not include an E27 socket. Please wear white gloves and carefully remove the 10W standard bulb so that it can be installed in the 0.3-meter Integrating Sphere Sphere. The 0.5-meter small Integrating Sphere Sphere includes an E27 socket; there is no need to remove the bulb.
Remove the 10W standard light bulb, as shown in Figure 5-8:
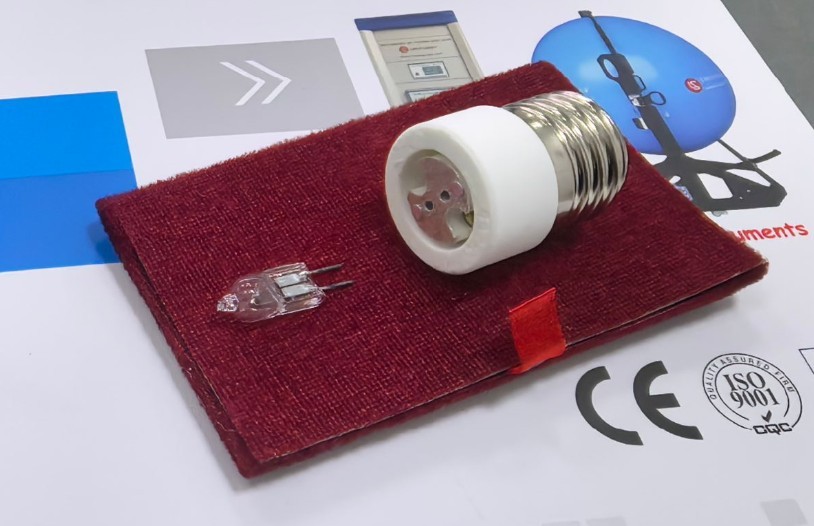
Figure 5-8
All other operations are exactly the same as those for Integrating Sphere; please refer to Section 5.2.
6. Testing
6.1 Integrating Sphere Test
6.1.1 Calibration Verification
Refer to Section 5.1 to determine whether recalibration is necessary.
6.1.2 Sample Installation
When the stage is mounted at the bottom, the sample’s light-emitting surface should face upward; when the stage is mounted at the top, the light-emitting surface should face downward—it must not face to the side. Use the crosshairs as a reference to adjust the sample’s position so that its light-emitting surface is exactly in the center of Integrating Sphere. Secure it firmly with screws or clamps to prevent it from falling during testing.
If the sample is an E27 light bulb, it can be mounted directly onto the stage or mounted onto the stage using an E27 adapter; no power cord is required. See Figure 6-1.
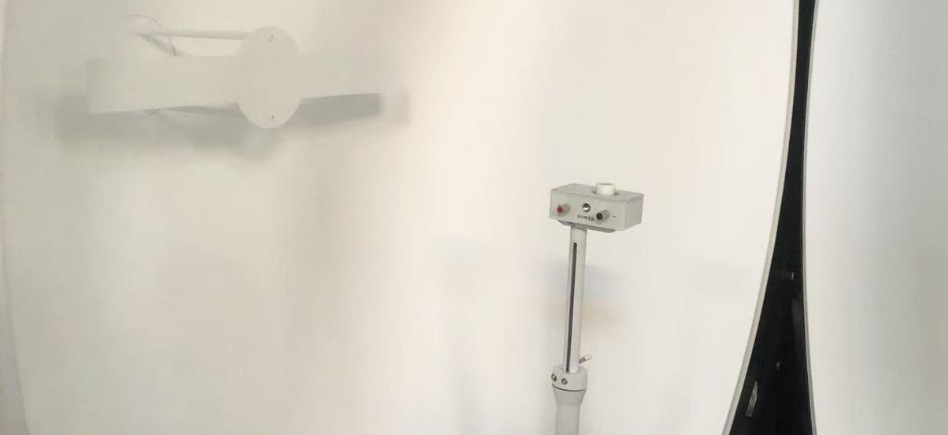
Figure 6-1
If the sample is a linear light fixture, a linear light fixture clamp may be installed and used, as shown in Figure 6-2.
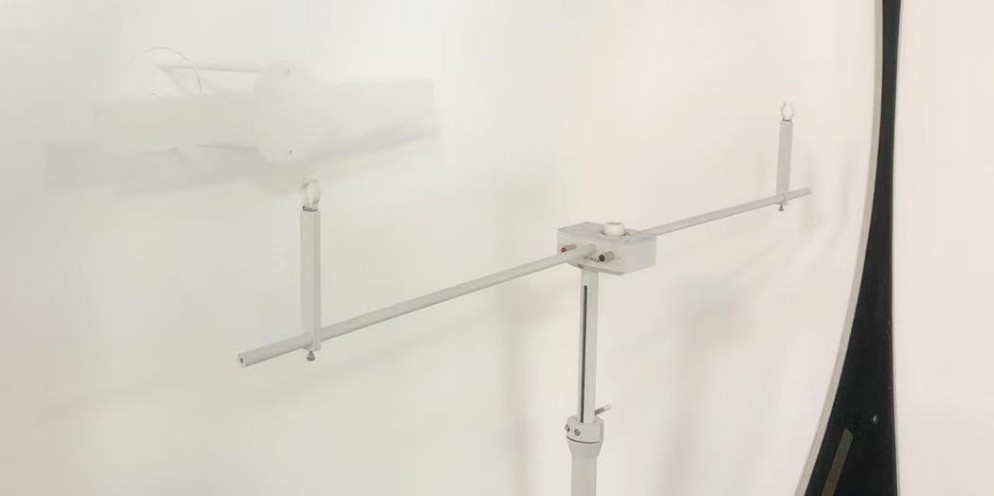
Figure 6-2
For other samples, place them directly on the stage or secure them with screws; the stage is equipped with M6 screw holes. Ensure that they do not fall off; see Figure 6-3.
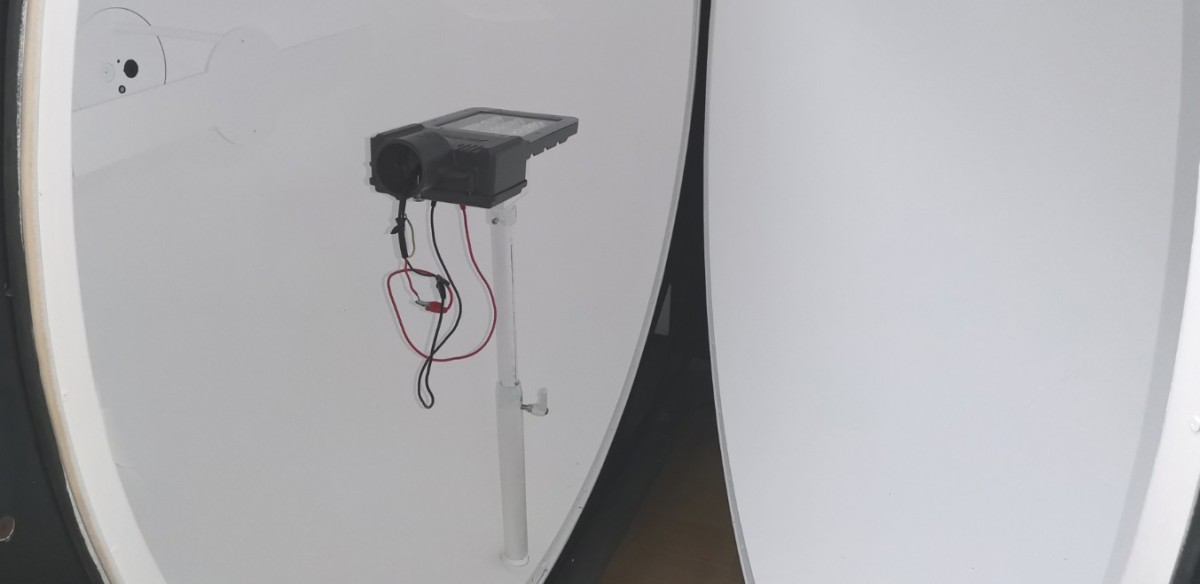
Figure 6-3
Connect the power cord to the two POWER terminals on the stage; the two SENSE terminals do not need to be connected. If using a DC-powered lamp, be sure to connect the positive and negative terminals correctly.
After installation, turn off the crosshair laser and Integrating Sphere. If your device includes two Integrating Sphere, make Integrating Sphere are turned off at the same time.
6.1.3 Cabinet Power Switching
If the sample is powered by DC, set the AC/DC switch on the cabinet to the DC position; if the sample is powered by AC, set the AC/DC switch on the cabinet to the AC position.
6.1.4 Verification of the Self-Absorption Coefficient
Integrating Sphere testing relies on diffuse reflection from the Sphere’s walls to take measurements. Therefore, if the sample is a relatively large luminaire, “self-absorption” may occur—that is, some of the diffuse reflected light is absorbed by the luminaire itself—which can cause deviations in the test results. Bare light sources and small luminaires can be tested directly; for larger luminaires, an Auxiliary Lamp must be used for correction, as shown in Figure 6-4.
| Number | Note |
| ① | Click “Self-Absorption Coefficient” |
| ② | For bare light sources or small luminaires, select “Do not use an auxiliary light for correction,” which corresponds to a correction factor of 1. For larger luminaires, select the appropriate correction factor from the drop-down list. If no correction factor has been generated for this sample previously, you will need to use an auxiliary light to generate a new correction factor; please refer to Chapter 8. |
| ③ | After selecting the correct auxiliary light correction factor, click “OK” to exit this page. |
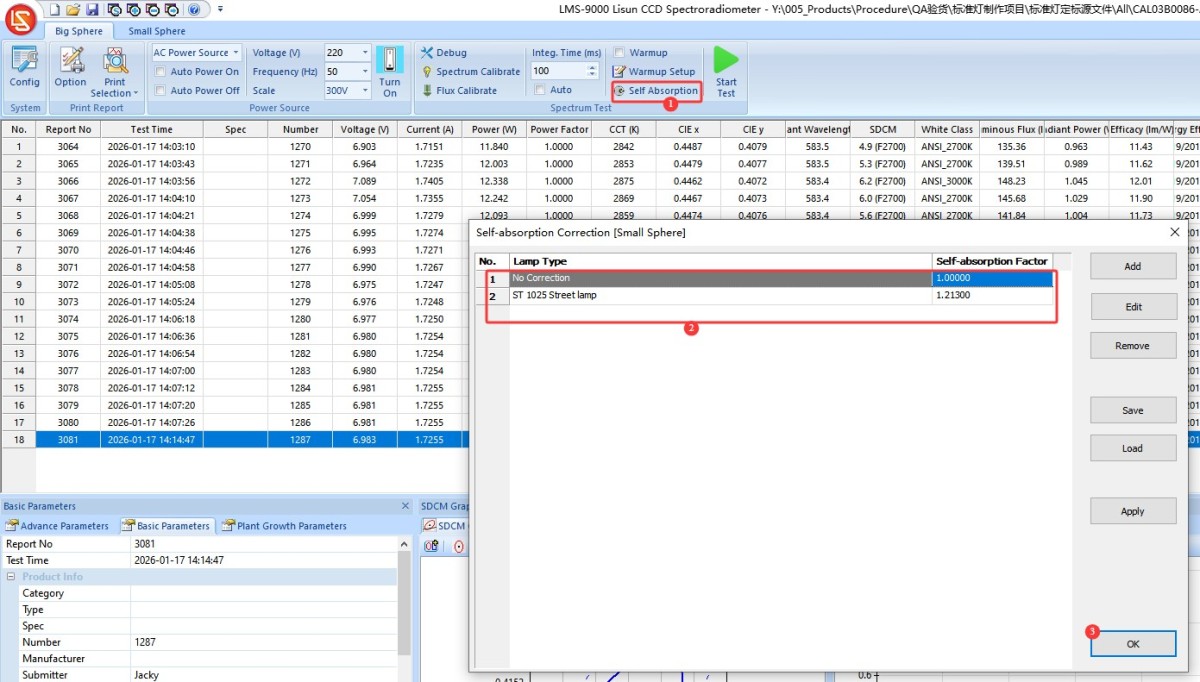
Figure 6-4
Note: Even if the software or computer is shut down, the software will still use the last self-absorption coefficient by default the next time it is opened. Therefore, you must verify that you are using the correct self-absorption coefficient before each test.
6.1.5 Verification of Power Parameters via Software Navigation
If the sample luminaire is powered by AC, see Figure 6-5:
| Number | Note |
| ① | Click the drop-down list and select “AC Power.” |
| ② | Enter the correct voltage and frequency for the sample luminaire |
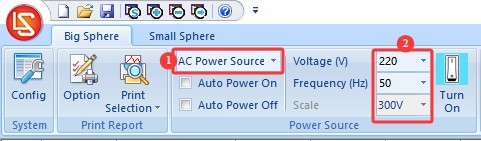
Figure 6-5
If the sample luminaire is powered by a DC power supply, see Figure 6-6:
| Number | Note |
| ① | Click the drop-down list and select “DC Power.” |
| ② | Enter the correct voltage and current for the sample lamp. Then select the output mode: CC for constant current mode and CV for constant voltage mode. |
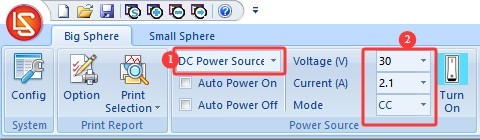
Figure 6-6
Note: If you need CC (Constant Current) mode, enter the sample’s rated current and the power supply’s maximum output voltage; if you need CV (Constant Voltage) mode, enter the sample’s rated voltage and the power supply’s maximum output current. If the sample fails to light up, please verify that the sample’s voltage and current are within the power supply’s output range. For example, the DC3005 model has a maximum output voltage of 30 V and a maximum output current of 5 A.
6.1.6 Confirmation of EEI Energy Efficiency Rating Settings
See Figures 6–7.
| Number | Note |
| ① | Click “System Configuration” |
| ② | Switch to the EEI tab |
| ③ | Select the applicable standards and the type of lighting fixture |
| ④ | Click OK to save |
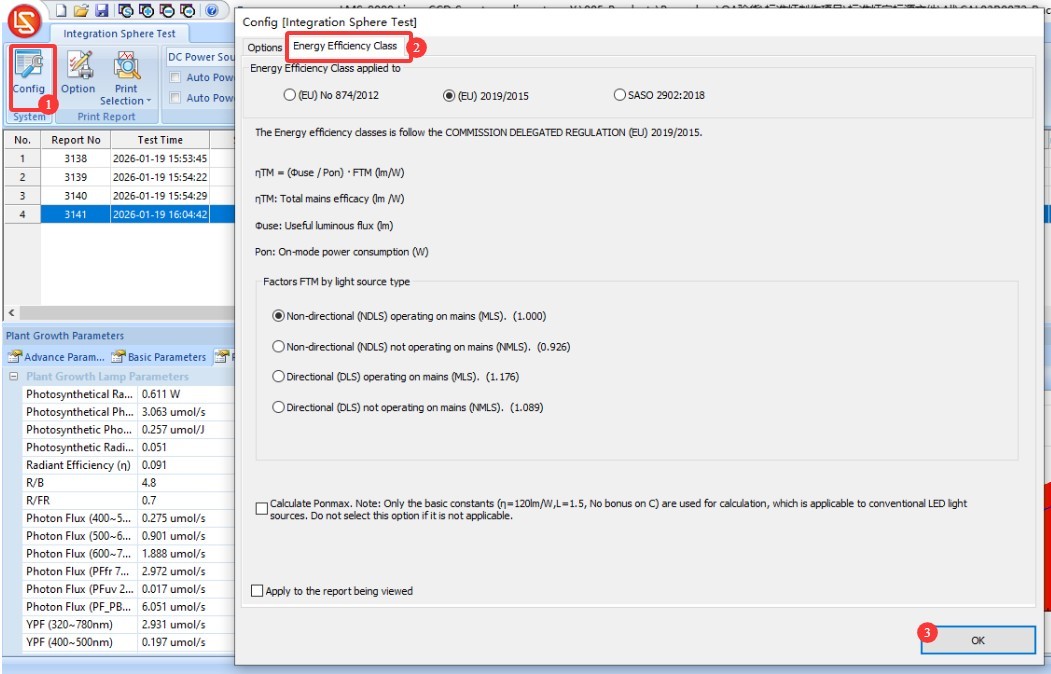
Figures 6–7
6.1.7 Preheating Parameter Settings
See Figures 6–8.
| Number | Note |
| ① | Click “Preheating Parameter Settings” |
| ② | Warm-up Duration Setting: The purpose of the warm-up is to allow the light fixture to remain on for a period of time until its luminous and color parameters stabilize, after which the test will proceed automatically. |
| ③ | Sampling interval: The software will automatically take samples at the set interval throughout the entire warm-up period to obtain real-time data. We recommend setting the interval to 5 seconds or longer. |
| ④ | If checked, the test will automatically skip the remaining warm-up time and begin once the light fixture has stabilized; if unchecked, the test will begin only after the warm-up period has elapsed as set. |
| ⑤ | If checked, test reports for all sampling points will be saved automatically; if unchecked, only the final test report will be saved automatically. |
| ⑥ | Definition of a luminaire’s steady state. If 20 and 0.5% are set, the luminaire is considered to be in a steady state if the parameter has not varied by more than 0.5% over the past 20 minutes. |
| ⑦ | You can select which parameters the software should use to determine whether a light fixture is stable: optical parameters, electrical parameters |
| ⑧ | The software will save the change curves for the selected parameters during the warm-up period to the test report. |
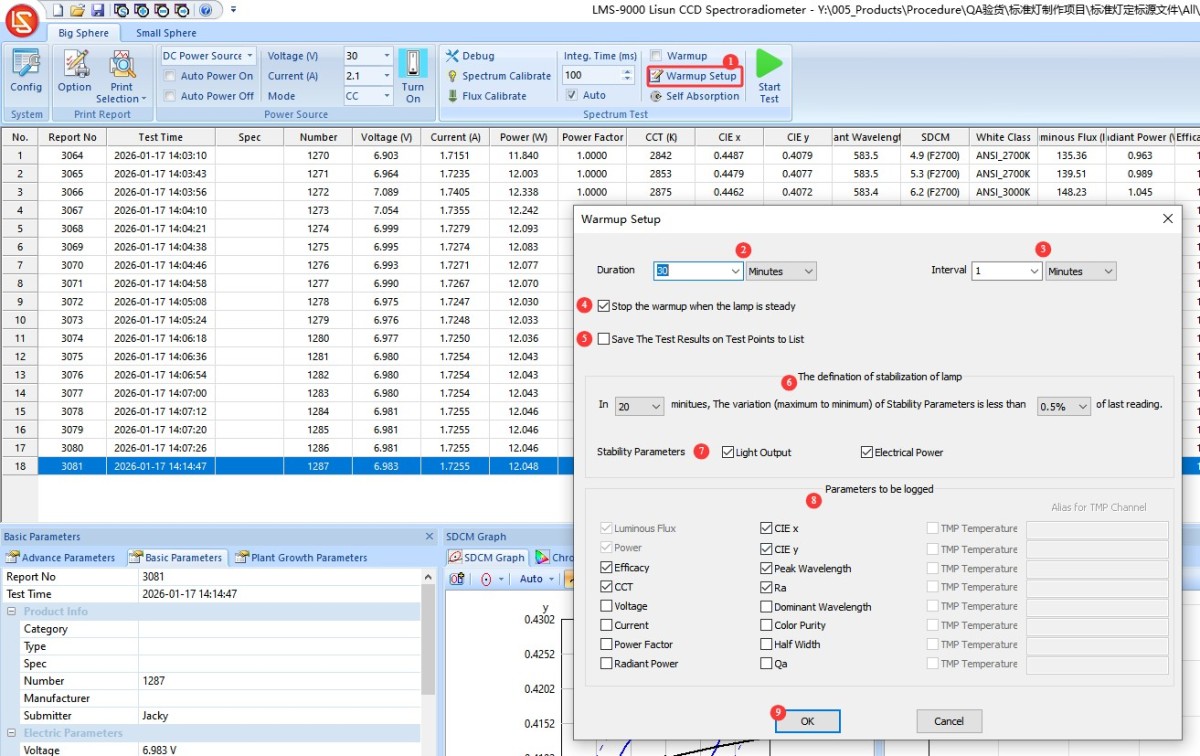
Figures 6–8
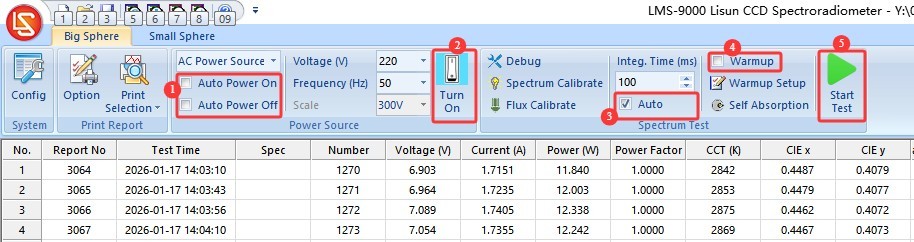
6.1.8 Verify the test control parameters and conduct the test
See Figures 6–9.
| Number | Note |
| ① | If the “Auto Turn On” and “Auto Turn Off” options are checked, clicking “Test” will cause the software to automatically turn on the light fixture according to the entered electrical parameters. Once the test is complete, the software will automatically turn off the light. Note: If you check the “Auto Turn On” option, you must also check “Preheat.” If you do not enable preheating—that is, if the software turns on the fixture and immediately begins testing—the interval between these actions will be too short, and the test results will not be reliable. |
| ② | If the “Auto On” and “Auto Off” options are not checked, you can also turn the light on or off by tapping this button. |
| ③ | Be sure to select “Automatic” for “Points Time”; otherwise, the test results will be inaccurate. |
| ④ | If you need to preheat, check the box; if not, leave it unchecked. |
| ⑤ | Click to run the test. If “Warm-up” is checked, the software will enter a warm-up countdown and display the current warm-up progress and data in the upper-right corner; if “Warm-up” is not checked, the software will run the test immediately and display the test results. |
Figures 6–9
During the warm-up process, the software interface appears as shown in Figure 6-10.
| Number | Note |
| ① | This section displays the preheating progress, as well as the current preheating parameters and curve. |
| ② | Click to skip the warm-up and go straight to the test |
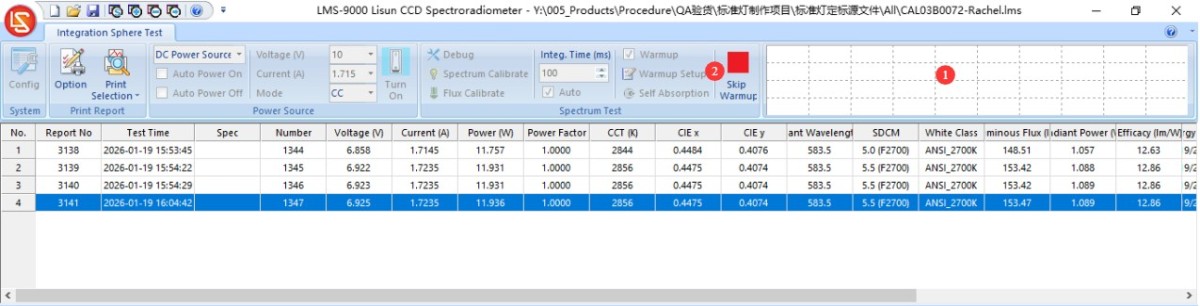
Figure 6-10
After the test is complete, all test reports are automatically saved in the current database file, as shown in Figure 6-11.
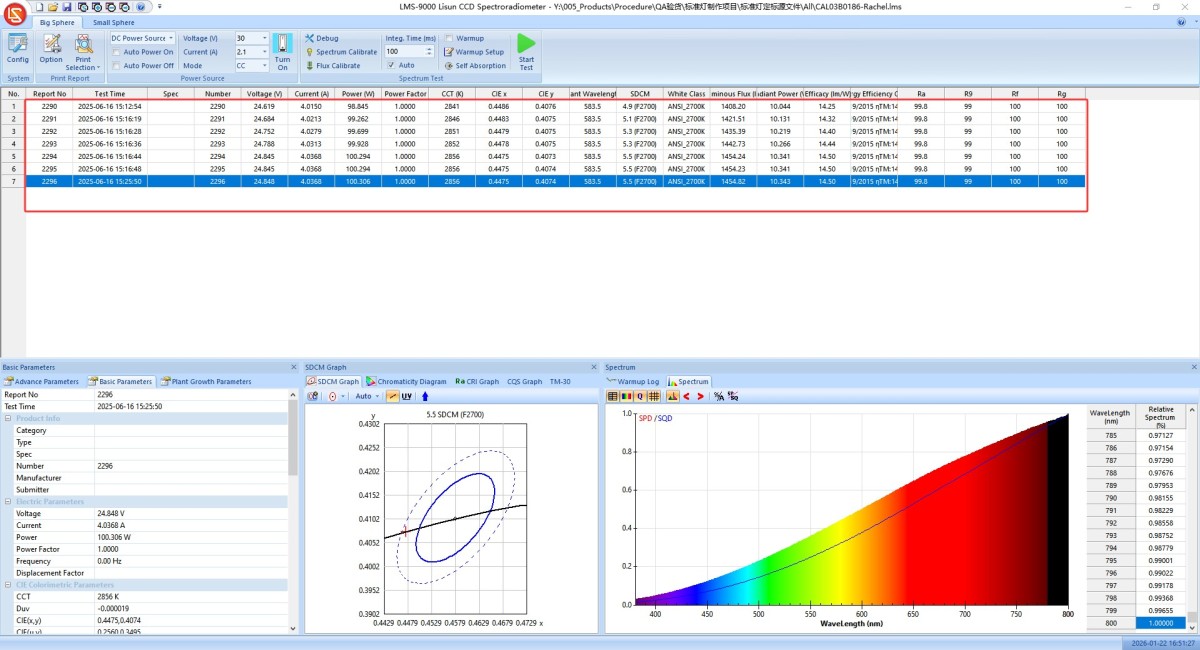
Figure 6-11
Please turn off the power to the sample luminaire and remove it. Do not store the luminaire inside Integrating Sphere when it is not being tested.
6.2 Small Integrating Sphere Test
Switch the software interface to “Small Integrating Sphere.”
The Xiaoji Ball does not have a fixture for auxiliary lights, so there is no need to apply any correction factors for auxiliary lights.
The remaining steps are identical to those in the Integrating Sphere test; please refer to Section 6.1.
7. Processing of Test Reports
7.1 Database File Processing
See Figure 7-1.
| Number | Note |
| ① | To delete a test report from the database file, select the report and click “Delete.” |
| ② | To make it easier to find test reports, click the blank button shown in the image below to create a new database file, and store reports for different luminaires in separate database files. After creating a new database file, you can proceed directly with testing without needing to recalibrate or reconfigure the system. |
| ③ | Click “Open” to open a previously saved database file. |
| ④ | Click OK to save |
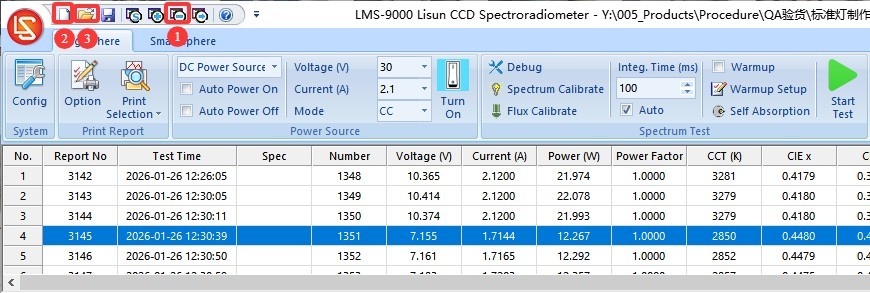
Figure 7-1
Note 1: The next time the software is opened, it will automatically load the database file used last time. If the path to that database file has changed or its name has been modified, the software will prompt you to create a new database file.
Note 2: Avoid placing database files on your computer’s desktop whenever possible.
7.2 Test Report Display Settings
Adjusting the software interface display. Click the logo in the upper-left corner, then click “Panel Options,” as shown in Figure 7-2.
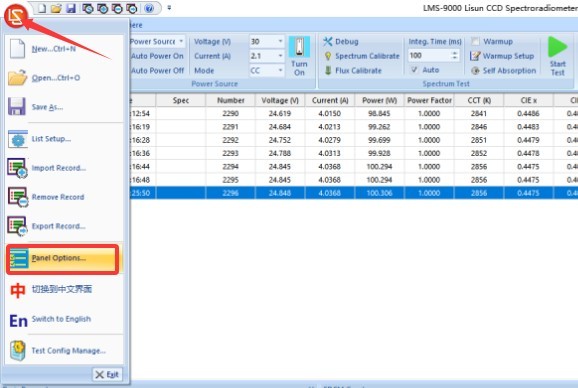
Figure 7-2
The following window appears, as shown in Figure 7-3.
| Number | Note |
| ① | You can choose which parameter modules to display on the software interface |
| ② | If checked, the software interface will revert to its default layout the next time it is launched. |
| ③ | Once you’ve configured the device, click OK to save. |
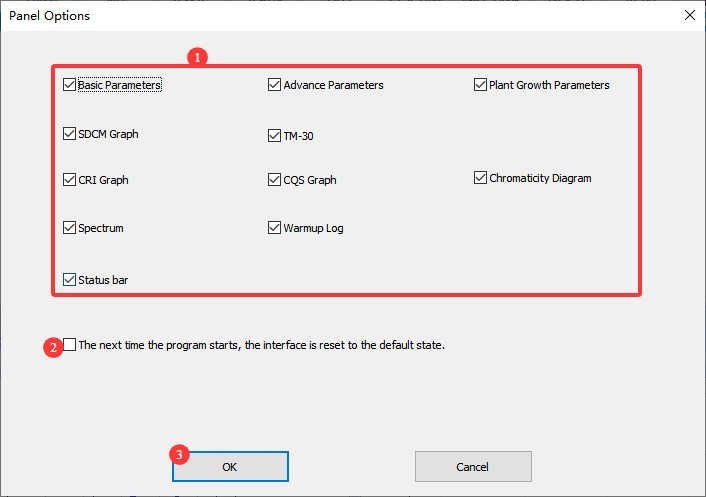
Figure 7-3
You can manually enter the report number and product information, as shown in Figure 7-4.
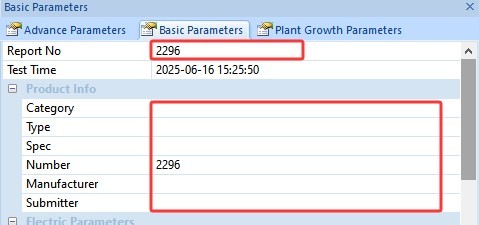
Figure 7-4
You can manually enter the laboratory name and the operator’s name, as shown in Figure 7-5.
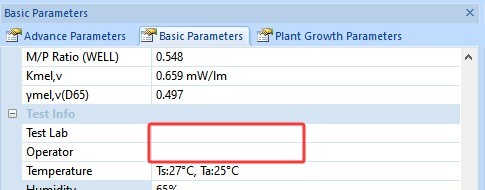
Figure 7-5
7.2 Exporting and Printing Test Reports
Click the red LISUN logo in the upper-left corner, then select “Export Data” from the drop-down menu, as shown in Figure 7-6:
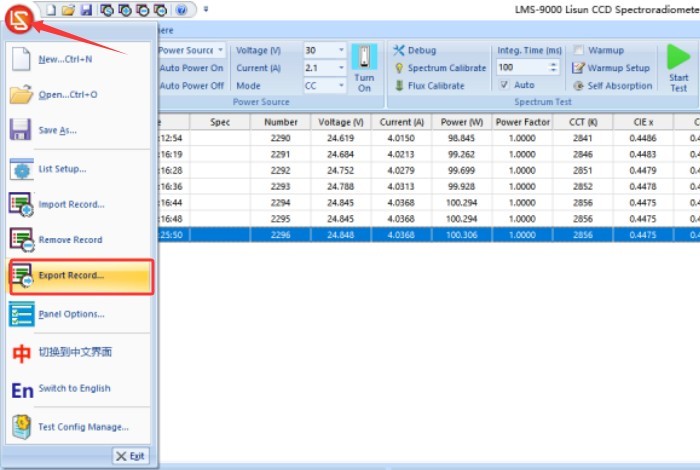
Figure 7-6
Data can be exported in all of the following formats, as shown in Figure 7-7:
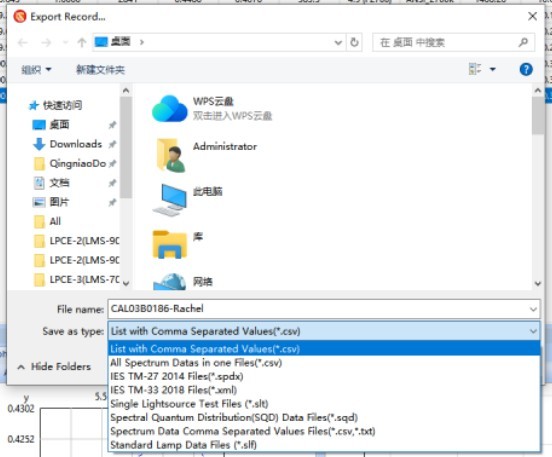
Figure 7-7
Click “Print Options” to configure the content to be displayed in the print report, as shown in Figures 7-8. To ensure the completeness of the test report, you can select all options or choose only those you need. Note: You can select only one of the CIE chromaticity diagram or the SDCM color tolerance diagram.
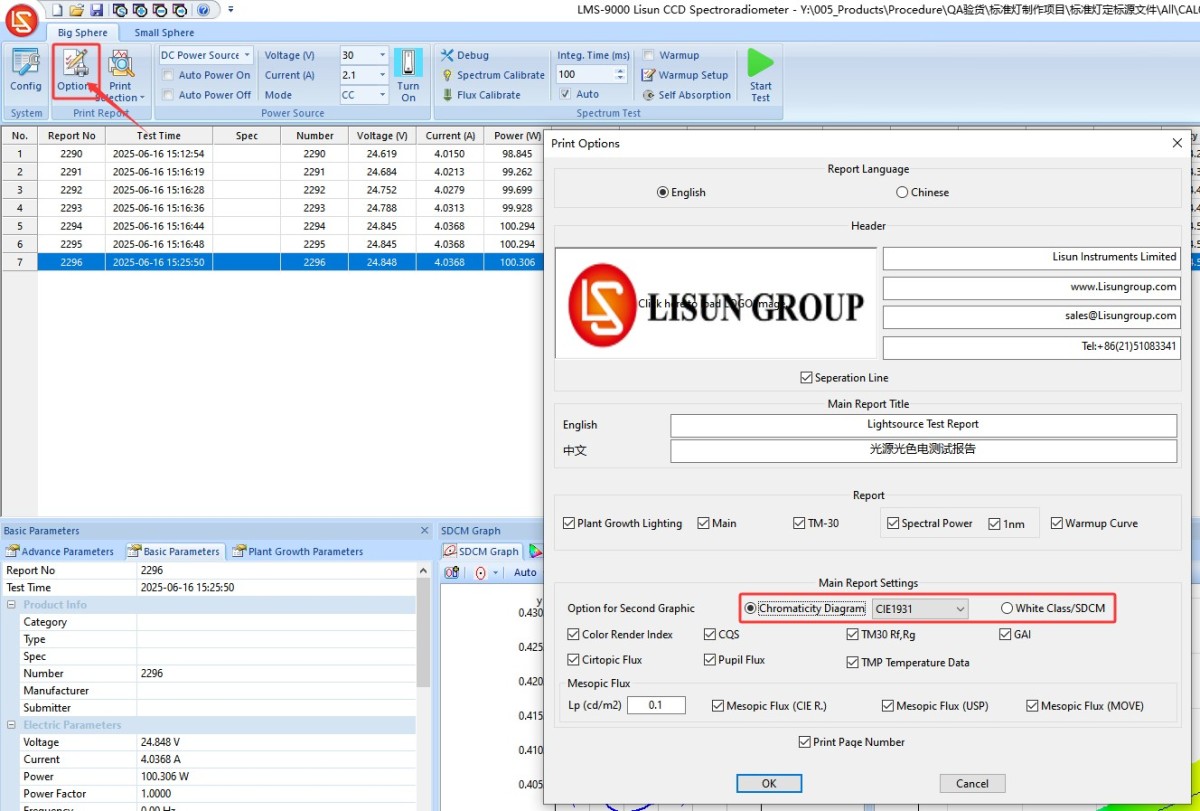
Figures 7–8
To print the test report, your computer must be connected to a printer or have a PDF printer installed, as shown in Figures 7–9.
| Number | Note |
| ① | Click to print the currently selected test report |
| ② | Click “Print All” in the drop-down list to print all test reports in the current database file. |
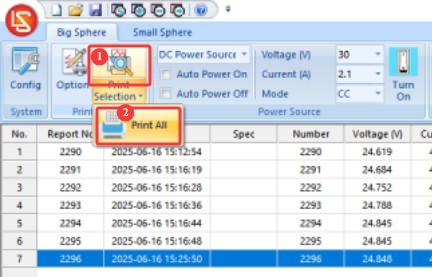
Fig. 7-9
The following shows the print output of the test reports; see Figures 7-10 through 7-13:
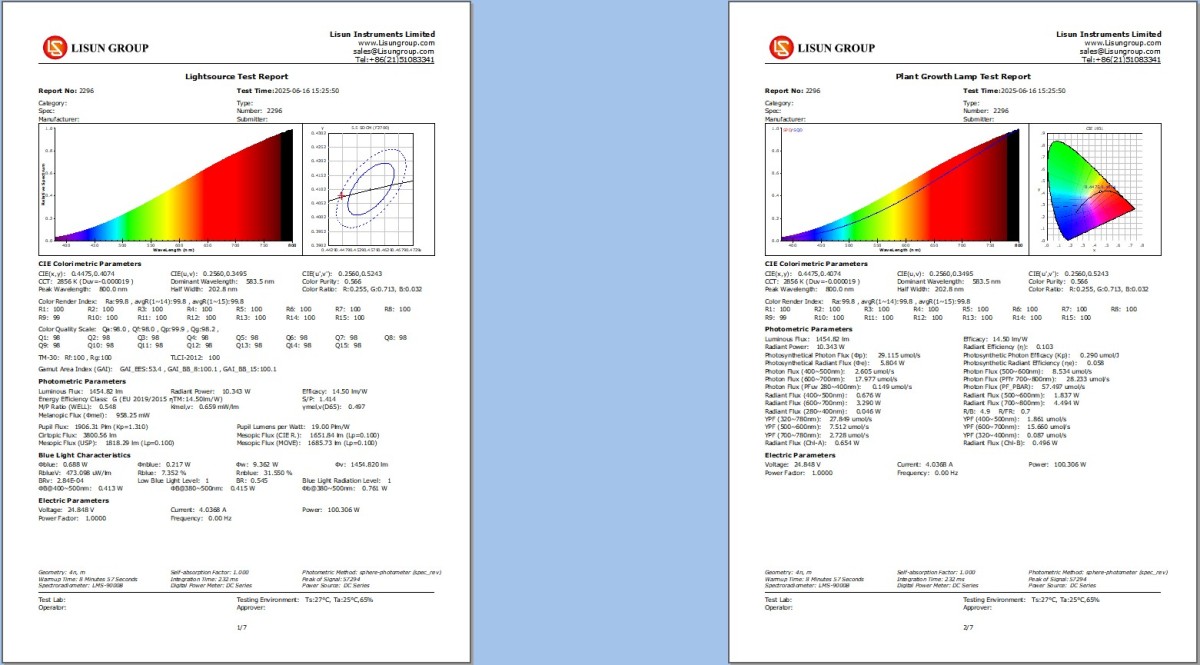
Figures 7–10
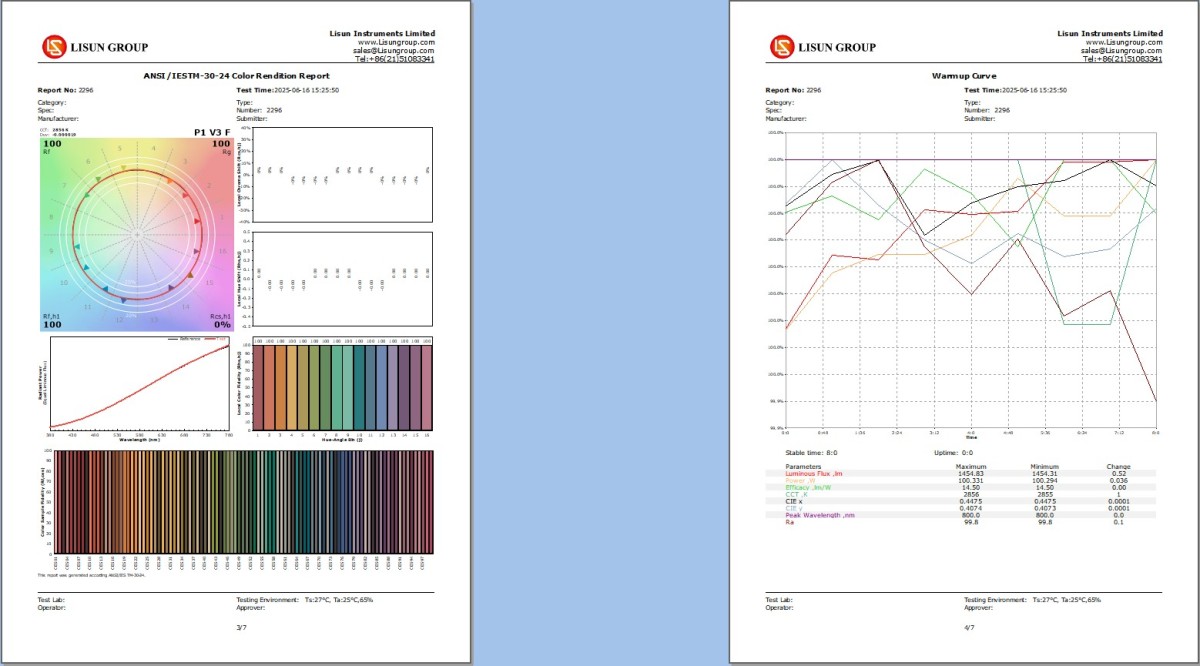
Figure 7-11
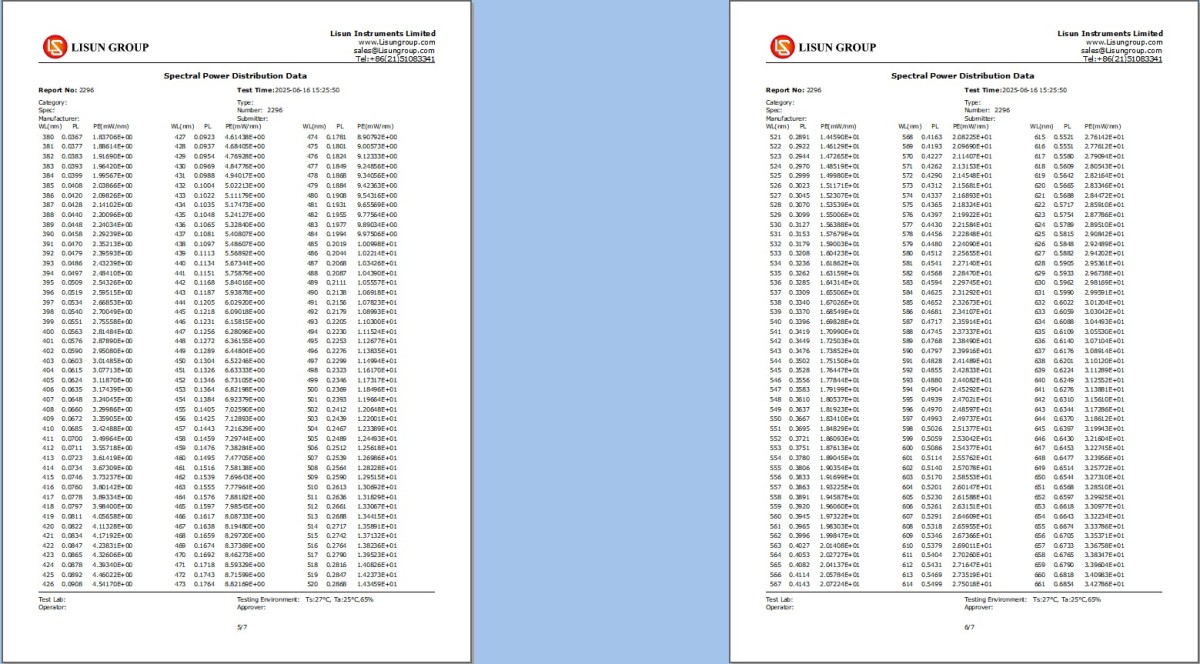
Figure 7-12
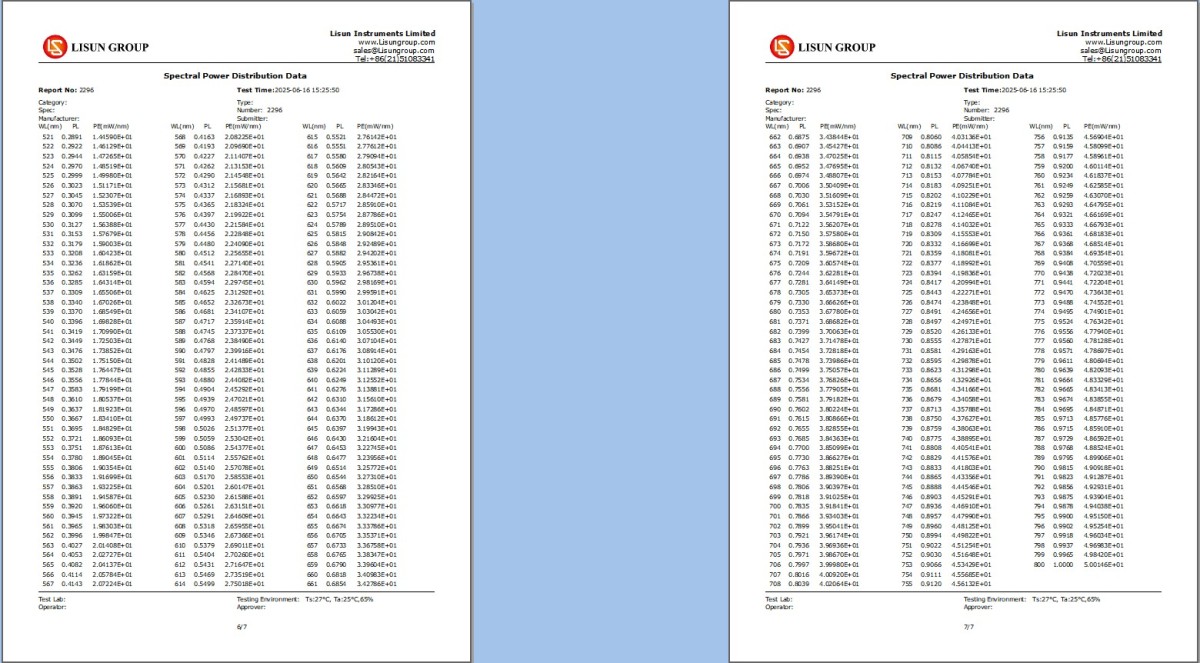
Figure 7-13
8. Generation of the Self-Absorption Coefficient (Use of an Auxiliary Light)
8.1 Scenarios for Using Auxiliary Lights
For larger luminaires, the issue of self-absorption may arise. If a correction factor for the auxiliary light has not been generated previously, you must first generate the correction factor using the auxiliary light before conducting the test. Self-absorption is related to the luminaire’s housing dimensions, shape, color, and other factors; therefore, the self-absorption coefficient varies for different luminaires.
Note: The darker the color of the luminaire and the larger its size, the more severe the “self-absorption” issue becomes. Users can gain practical experience regarding whether to apply an auxiliary light correction factor. For example, for certain small luminaires, if the correction factor obtained after applying the auxiliary light correction factor is 1.02, this indicates that the luminous flux test result will increase by 2% after applying the correction factor; For example, for certain large luminaires, if the correction factor obtained after applying the auxiliary light correction is 1.13, this indicates that the luminous flux test result will increase by 13% after applying the correction factor.
8.2 Installation and Wiring of Auxiliary Lights
① Remove the plug from the opposite side of Integrating Sphere large Integrating Sphere to prepare for installing the auxiliary light fixture; see Figure 8-1.
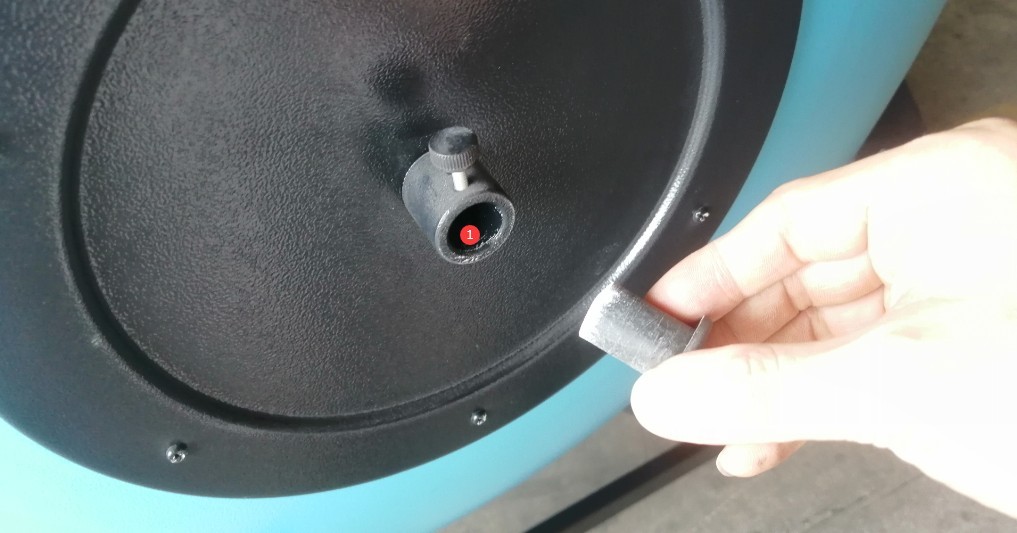
Figure 8-1
Locate the auxiliary light fixture, as shown in Figure 8-2:
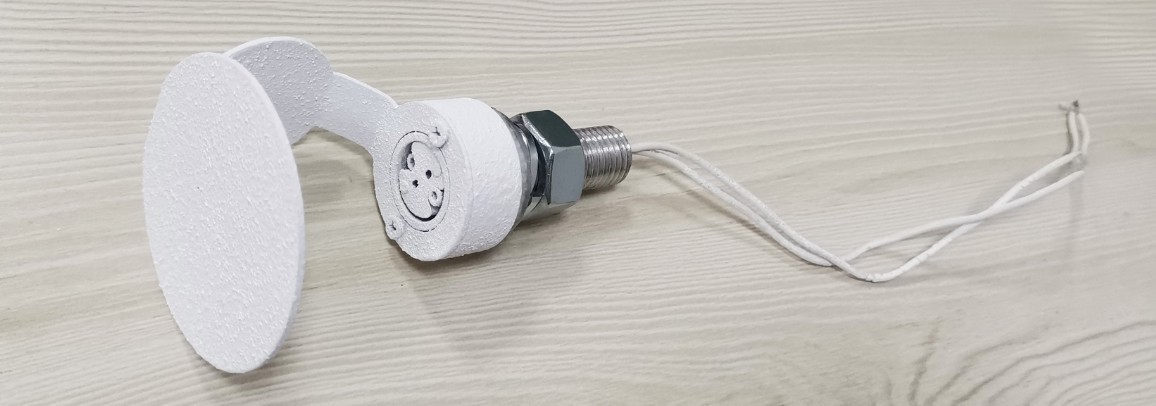
Figure 8-2
Remove the screws and washers, as shown in Figure 8-3:
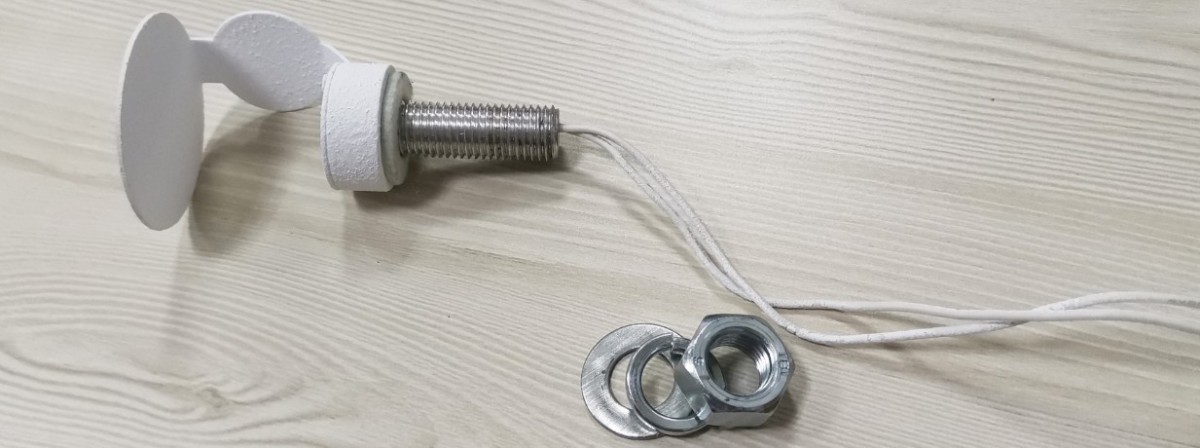
Figure 8-3
Feed the auxiliary light fixture out from the inside of Integrating Sphere, as shown in Figure 8-4:
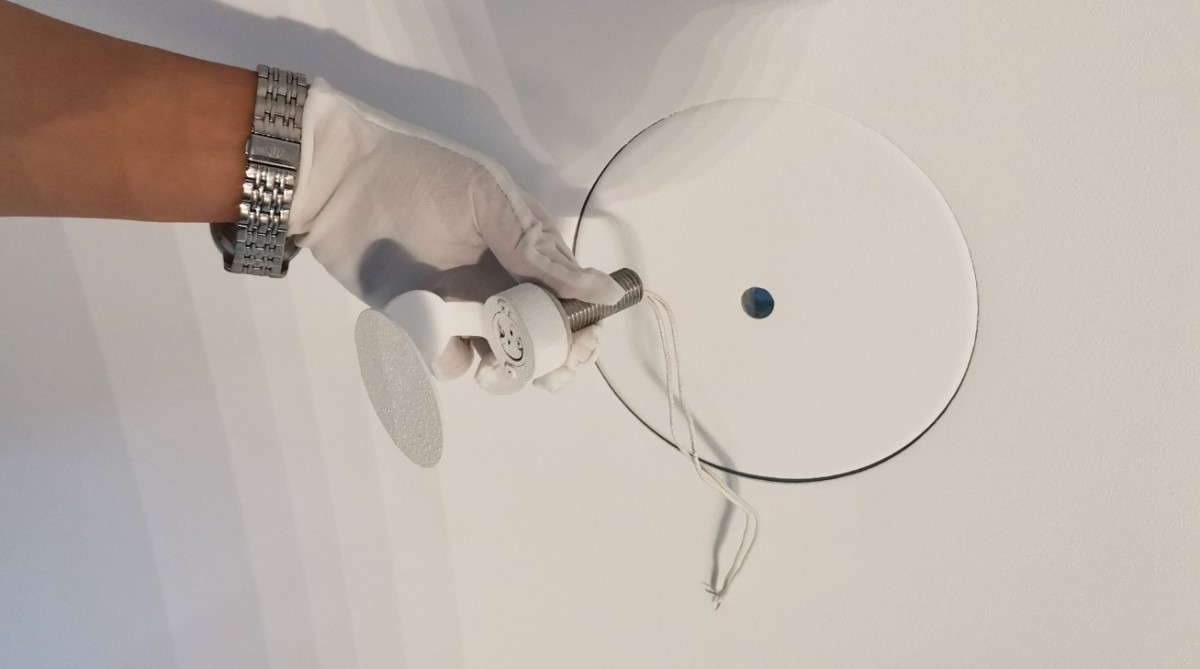
Figure 8-4
For auxiliary light wiring, see Figure 8-5.
| Number | Note |
| ① | Then secure the screws and washers to the outside of Integrating Sphere |
| ② | Please connect an extension cord with a banana plug to the side of the cabinet and keep it on hand. Note: We do not provide the wire connecting the auxiliary light to the DC power supply; we only provide the banana plug. Please find a wire of the appropriate length and make the connection yourself. |
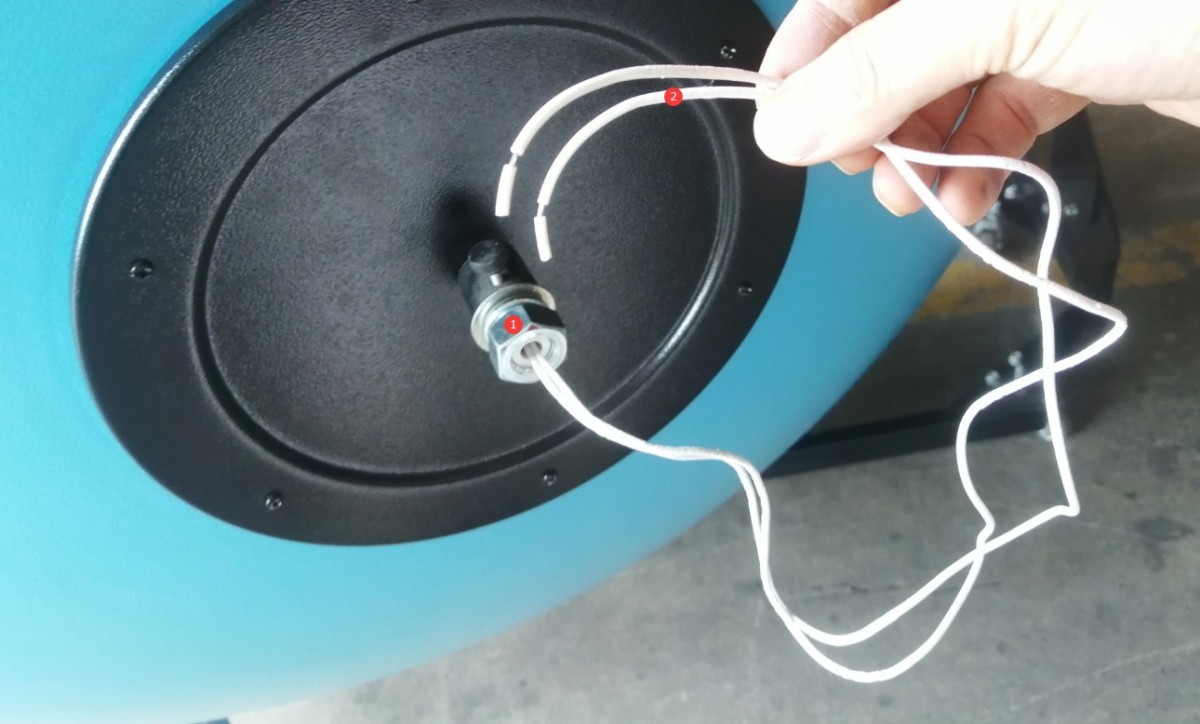
Figure 8-5
Adjust the length of the wire to ensure that Integrating Sphere can be properly connected to the front panel of the DC power supply, whether it is closed or open, as shown in Figure 8-6.
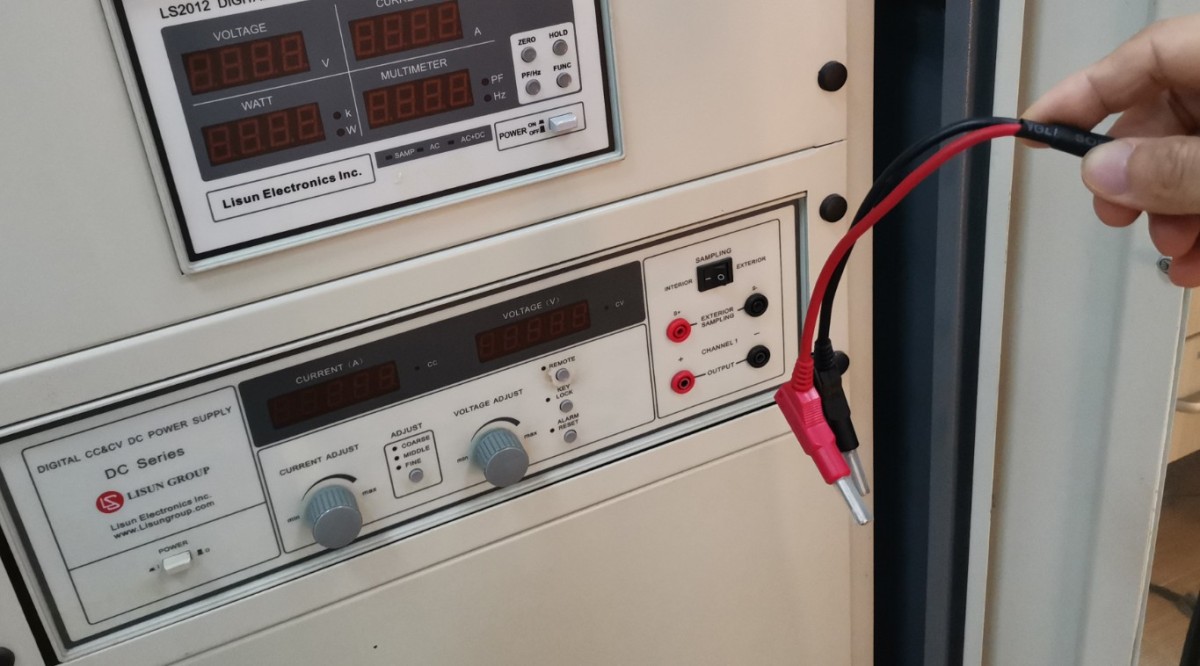
Figure 8-6
Please wear gloves, remove the auxiliary light bulb, and install it in the auxiliary light fixture, as shown in Figure 8-7.
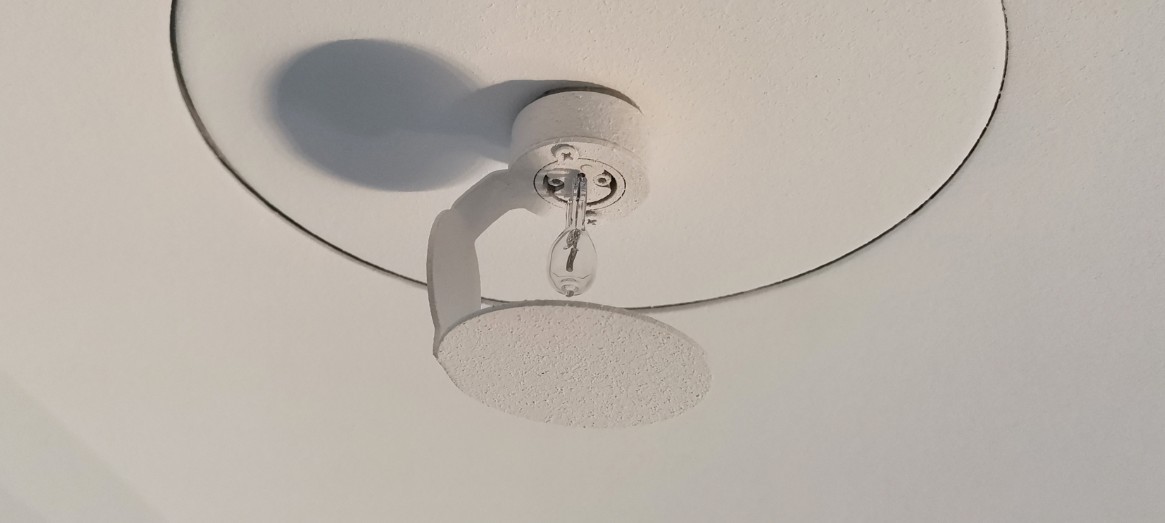
Figure 8-7
8.3 Steps for Generating the Self-Absorption Coefficient
Connect the auxiliary light power cord to the output terminal on the front panel of the DC power supply, as shown in Figure 8-8.
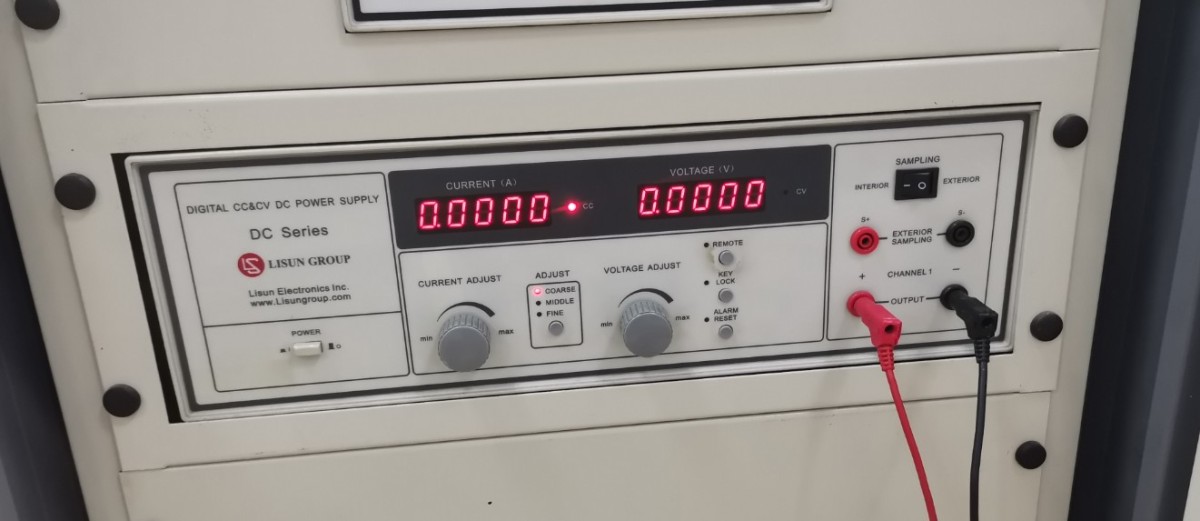
Figure 8-8
Go to the self-absorption coefficient interface, as shown in Figures 8 and 9.
| Number | Note |
| ① | Click “Self-Absorption Coefficient” |
| ② | Click “Add” |
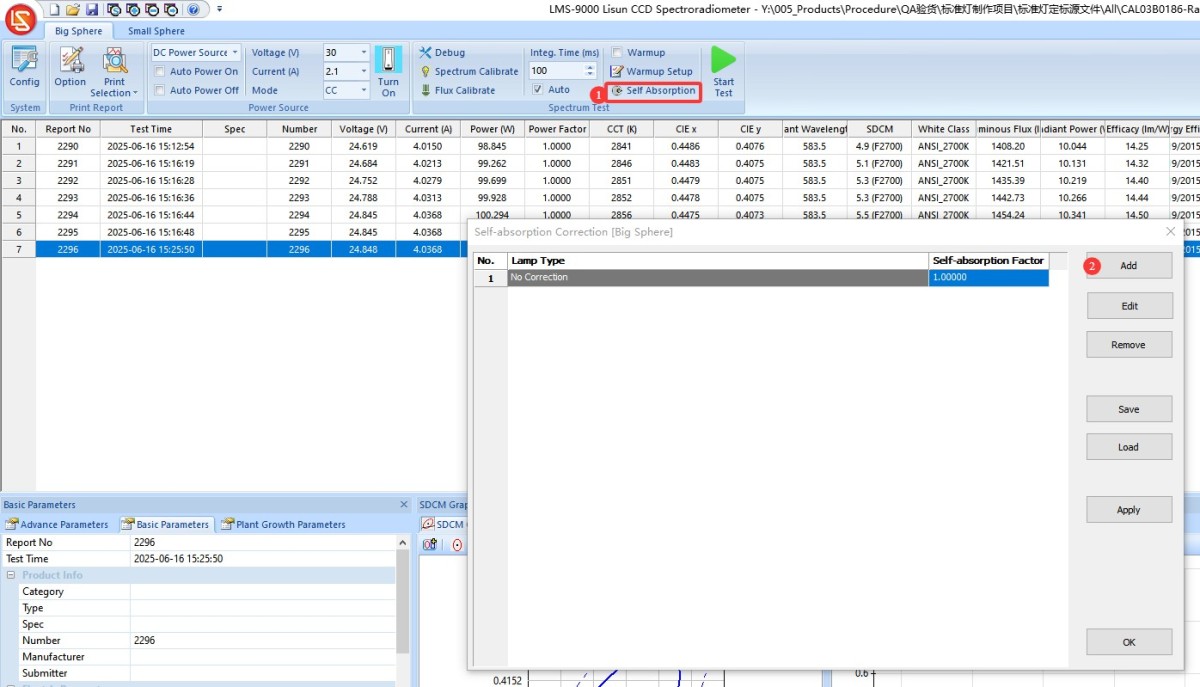
Figures 8–9
Generated from the absorption coefficient, Step 1; see Figures 8–10.
| Number | Note |
| ① | Enter the model number of the luminaire under test. If you test the same luminaire again later, you only need to select the corresponding correction factor from the list of self-absorption coefficients; there is no need to generate the correction factor again. |
| ② | A: If the DC power supply has successfully established communication in “System Configuration,” the correct DC power supply model and port number will automatically be displayed here; you can also click “Search” to rescan for the correct port . B: If you have not purchased a LISUN DC power supply or communication has not been established, please select “Not Installed” for the DC power supply model; otherwise, the software will display an error. |
| ③ | A: If the software has successfully communicated with the DC power supply, the auxiliary lamp data can be found on the packaging and the calibration certificate; enter the rated current and reference voltage . B: If the software has not successfully communicated with the DC power supply, there is no need to enter the current, voltage, or warm-up time ; generally, a 15-minute warm-up is sufficient. |
| ④ | Follow the instructions here for Steps 1 and 2. At this point, both the standard lamp and the auxiliary lamp are inside Integrating Sphere. The standard lamp must be installed exactly at the center of Integrating Sphere, but do not connect its power cord (it is used only to simulate the calibration environment). Then, turn off Integrating Sphere. If your device includes Integrating Sphere, turn Integrating Sphere off at the same time. |
| ⑤ | A: If the software has successfully established communication with the DC power supply, you can simply click “Start.”and the software will automatically control the DC power supply to illuminate the auxiliary light at a constant current, then enter the warm-up countdown . B: If the software fails to establish communication with the DC power supply, you must first manually control your DC power supply to illuminate the auxiliary light at a constant current, then click “Start” to enter the warm-up countdown. |
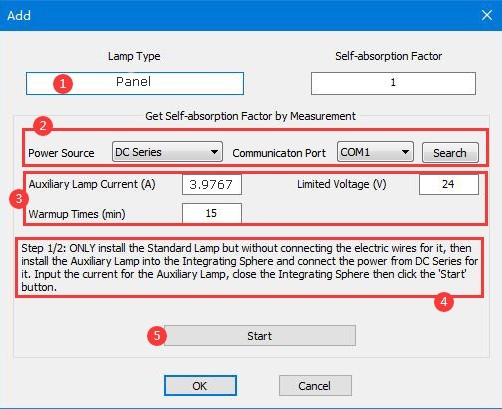
Figures 8–10
Generated from Step 2 of the absorption coefficient calculation; see Figures 8–11.
| Number | Note |
| ① | After the 15-minute warm-up period, the software proceeds to Step 2 of 2. Following the instructions here, open Integrating Sphere, remove the standard lamp, and place the lamp under test in the center of Integrating Sphere—but do not connect the power cord to the lamp under test (this is only for simulating the test environment). At this point, the auxiliary lamp remains on. Then close Integrating Sphere. |
| ② | Click “Finish.” The software will automatically calculate the self-absorption coefficient. |
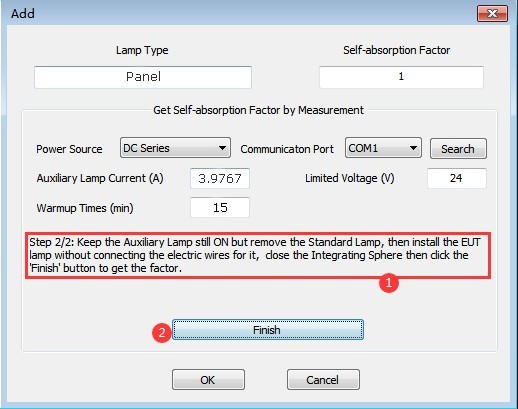
Figures 8–11
Autocorrelation coefficient generation; see Figures 8–12.
| Number | Note |
| ① | Self-absorption coefficient calculated automatically by the software |
| ② | Click “OK” to automatically save and exit the self-absorption coefficient generation interface. A: If the software has successfully communicated with the DC power supply, you can turn off the auxiliary light through the software. B: If the software has not successfully communicated with the DC power supply, you can manually turn off the DC power supply output. |
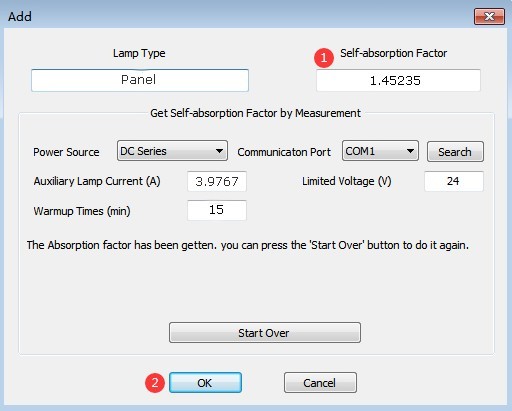
Figures 8–12
After using the auxiliary light, be sure to disconnect its power cord. If the auxiliary light will not be used for an extended period, allow it to cool down, then remove it and store it properly.
8.4 Testing Using the Auxiliary Light Correction Factor
During testing, the auxiliary light correction factor just generated will be used by default. Please refer to Chapter 6 for testing instructions.
Note: The auxiliary lights are used solely to generate correction factors; please do not turn them on during official testing.
9. Daily Maintenance and Care of Equipment
9.1 Hardware
9.1.1 Daily Maintenance
Before turning on the device, check that Integrating Sphere is closed and that there is no dust or debris inside; check that all connections are secure and that the USB cable and Optical Fiber are not damaged; after turning off the device, close Integrating Sphere, disconnect the main power supply, and wipe dust from the surface of the device.
9.1.2 Weekly Maintenance
Open Integrating Sphere Integrating Sphere and use a hair dryer (set to the cool air setting) to blow out the dust from the inside out, preventing the dust from adhering to the coating; inspect the packaging of the standard lamp to ensure it is free of moisture and damage, and verify the expiration date.
9.1.3 Monthly Maintenance
Inspect the coating Integrating Sphere: If there is minor peeling, contact us to obtain coating repair materials; if there is extensive peeling, Integrating Sphere must be replaced.
9.1.4 Annual Maintenance
Replace standard bulbs (regardless of whether they are working or not; they must be replaced when they reach the end of their service life).
9.2 Software
We will update the software from time to time to add features and fix bugs. If you encounter any issues while using the software, please feel free to contact us at any time to obtain the latest version.
9.3 Long-Term Decommissioning and Maintenance
9.3.1 Equipment Cleaning and Protection
Thoroughly clean all equipment surfaces, and cover the cabinets and Integrating Sphere with dust-proof cloths; disconnect all power sources, and unplug power cords and communication cables.
9.3.2 Environmental Protection
Ensure that the laboratory is dry and well-ventilated to prevent equipment from becoming damp. If the ambient humidity is high, keep a dehumidifier on hand.
9.3.3 Monthly Power-On
Power on the system once a month to ensure that all hardware components are functioning properly.
9.4 Calibration Interval Requirements
To ensure the measurement accuracy and operational reliability of the equipment, it is recommended that it be sent periodically to a qualified third-party metrology laboratory for calibration. The recommended calibration interval is 12 months. Users may determine the specific calibration interval based on usage frequency, environmental conditions, and quality system requirements.
10. Troubleshooting and Resolving Common Problems
10.1 Hardware Communication Failures
Causes of the problem: Driver not installed or installation failed; incorrect USB port connection; incorrect device model selected;
Troubleshooting Steps: Check the computer’s Device Manager to verify that the LMS-9000 and the four COM ports are functioning properly (no exclamation marks);
Reinstall the drivers (with antivirus software disabled) to ensure that both the communication box driver and the spectrometer driver are successfully installed; connect the USB cable directly to a native USB 2.0 or 3.0 port on your computer (do not use a USB hub or USB extension cable); go to “System Configuration” in the software, reselect the device model, and click “Search for Port.”
10.2 Calibration Errors
10.2.1 The standard lamp won’t turn on
Causes of malfunction: The AC/DC switch is not set to the DC position; “Auto-Light” is not checked on the calibration screen; incorrect voltage or current parameters; broken filament;
Troubleshooting Steps: Ensure the AC/DC switch on the cabinet is set to “DC” and that the standard lamp is securely connected; verify that “Auto Illumination” is checked on the calibration interface, and that the entered voltage and current match those specified in the standard lamp certificate; inspect the standard lamp filament—if it is broken or blackened, replace the standard lamp.
10.2.2 Calibration Prompt: “Signal Too Weak”
Causes of malfunction: Optical Fiber connected; Integrating Sphere lid not closed properly; standard lamp not lit; Optical Fiber kinked or broken;
Troubleshooting: Check that Optical Fiber is securely connected at both ends and is not excessively bent; close Integrating Sphere to ensure it is properly sealed and no external light is entering; verify that the standard lamp is lit; if it is not, follow the troubleshooting steps in Section 5.2; if Optical Fiber is broken, contact us for a replacement.
10.3 Test Data Anomalies
10.3.1 Inaccurate Test Data
Causes of malfunction: Failure to perform regular calibration, incorrect correction factor for the auxiliary lamp, improper selection of Integrating Sphere, damaged coating, or issues with the sample itself
Procedure: Recalibrate according to Chapter 5, ensuring the calibration interval is ≤ 1 week; set the correction factor to 1 for bare light sources and small luminaires, and use the correct correction factor for large luminaires; Use Integrating Sphere for large samples and a small Integrating Sphere for small samples to avoid size mismatches; if the Integrating Sphere Sphere’s coating is severely peeling or has significantly darkened, contact us for repair; test several additional sets of different sample types; if most results are acceptable, the issue lies with the sample itself.
10.3.2 Excessive Variation in Test Results
Cause of the malfunction: Insufficient preheating time; severe sample flicker;
Solution: Extend the warm-up time (e.g., 20–30 minutes) and wait for the sample to stabilize before testing; use a flicker tester to check the sample for flicker issues.
10.3.3 Electrical parameters are displayed as 0
Cause of the malfunction: Incorrect selection of the power meter model; incorrect wiring;
Troubleshooting Steps: Go to “System Configuration” in the software, select the correct power meter model, and rescan the ports; check the power meter wiring to ensure that A1, A2, V1, and V2 are connected correctly and securely.
10.4 Software Operation Errors
10.4.1 The software won’t start (no response when double-clicked)
Cause of the problem: Not running as an administrator; incomplete software installation;
Solution: Right-click the software shortcut and select “Run as administrator”; uninstall the old software, delete any remaining folders, and then reinstall the software.
10.4.2 Software Fails to Open or Database File Error
Causes of the problem: Insufficient software permissions, the save path does not exist, or the file is in use;
Solution: Run the software as an administrator; create a new database file; do not save the database file directly to your desktop.
10.5 Power Failure
10.5.1 DC Power Output Abnormalities
Causes of the malfunction: The AC/DC switch on the cabinet was not set to DC; the sample voltage or current exceeded the DC power supply limits; a short circuit in the sample;
Troubleshooting: Please verify that the sample’s voltage and current are within the DC power supply’s output range. For example, the DC3005 model has a maximum output voltage of 30 V and a maximum output current of 5 A. Check whether the sample is short-circuited; if so, repair the sample before retesting.
10.5.2 No AC Output
Cause of the malfunction: The AC/DC switch on the cabinet was not set to the AC side, and the overload protection was triggered;
Troubleshooting Steps: Check the AC power output wiring and sample connections to ensure there are no loose connections or short circuits; if the overload protection is triggered, turn off the power, let the unit cool for 5 minutes, and then restart it. Ensure that the sample power remains within the AC power output range—for example, the LSP-500VARC has a maximum output power of 500W.